

Watershed health — Upper Columbia update
We investigated the health of stream habitats in the Upper Columbia Status and Trends Region in 2012 and 2017. Based on these study years, the region showed a majority of good biological conditions, with the highest physical and chemical stressors relating to substrate and water chemistry.
Use the map to navigate our reports by Status and Trends Region.
Regional summary
- Benthic Index of Biotic Integrity (B-IBI) conditions were consistent in the Upper Columbia Region, with a majority of stream kilometers assessed classifies as being in good biological condition.
- The most prevalent stressors for streams in the Upper Columbia Region were elevated sand/fine sediment, increased substrate embeddedness, and increased water temperatures.
Biological condition
Invertebrate biological condition of streams, as assessed with B-IBI scores, did not change significantly from 2012 to 2017 in the Upper Columbia Region. The proportion of stream kilometers assessed that were classified as being in good biological condition was high in both 2012 and 2017. There was a slight increase in 2017 in the proportion of stream kilometers classified as being in poor biological condition, yet the majority of stream kilometers in this region were in good biological condition.
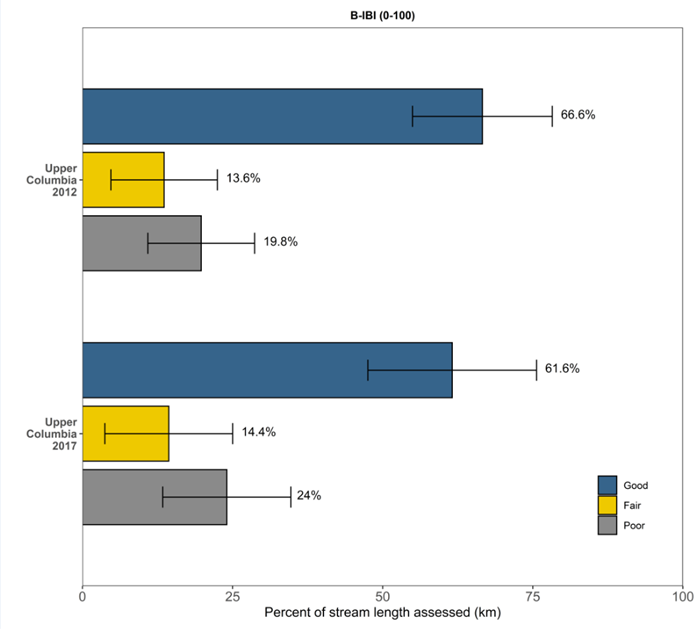
We used B-IBI ratings from 2012 and 2017 to obtain the percentage of stream kilometers in good, fair, or poor condition for the Upper Columbia Region. Error bars represent 95% confidence intervals.
Significant physical and chemical stressors
In the Upper Columbia Region, some of the most common stressors were those associated with stream substrate, such as elevated sand or fines, embeddedness, and lower bed stability. Elevated water temperatures, high nutrients, and elevated pH were also observed in this region.
To interact with this graph and learn more about these stressors, hold your mouse over each bar.
This interactive graph shows the percentage of stream kilometers assessed with poor physiochemical conditions in the Upper Columbia Region for 2012 and 2017. The x-axis represents the percentage of river extent in poor condition. Error bars show 95% confidence intervals.
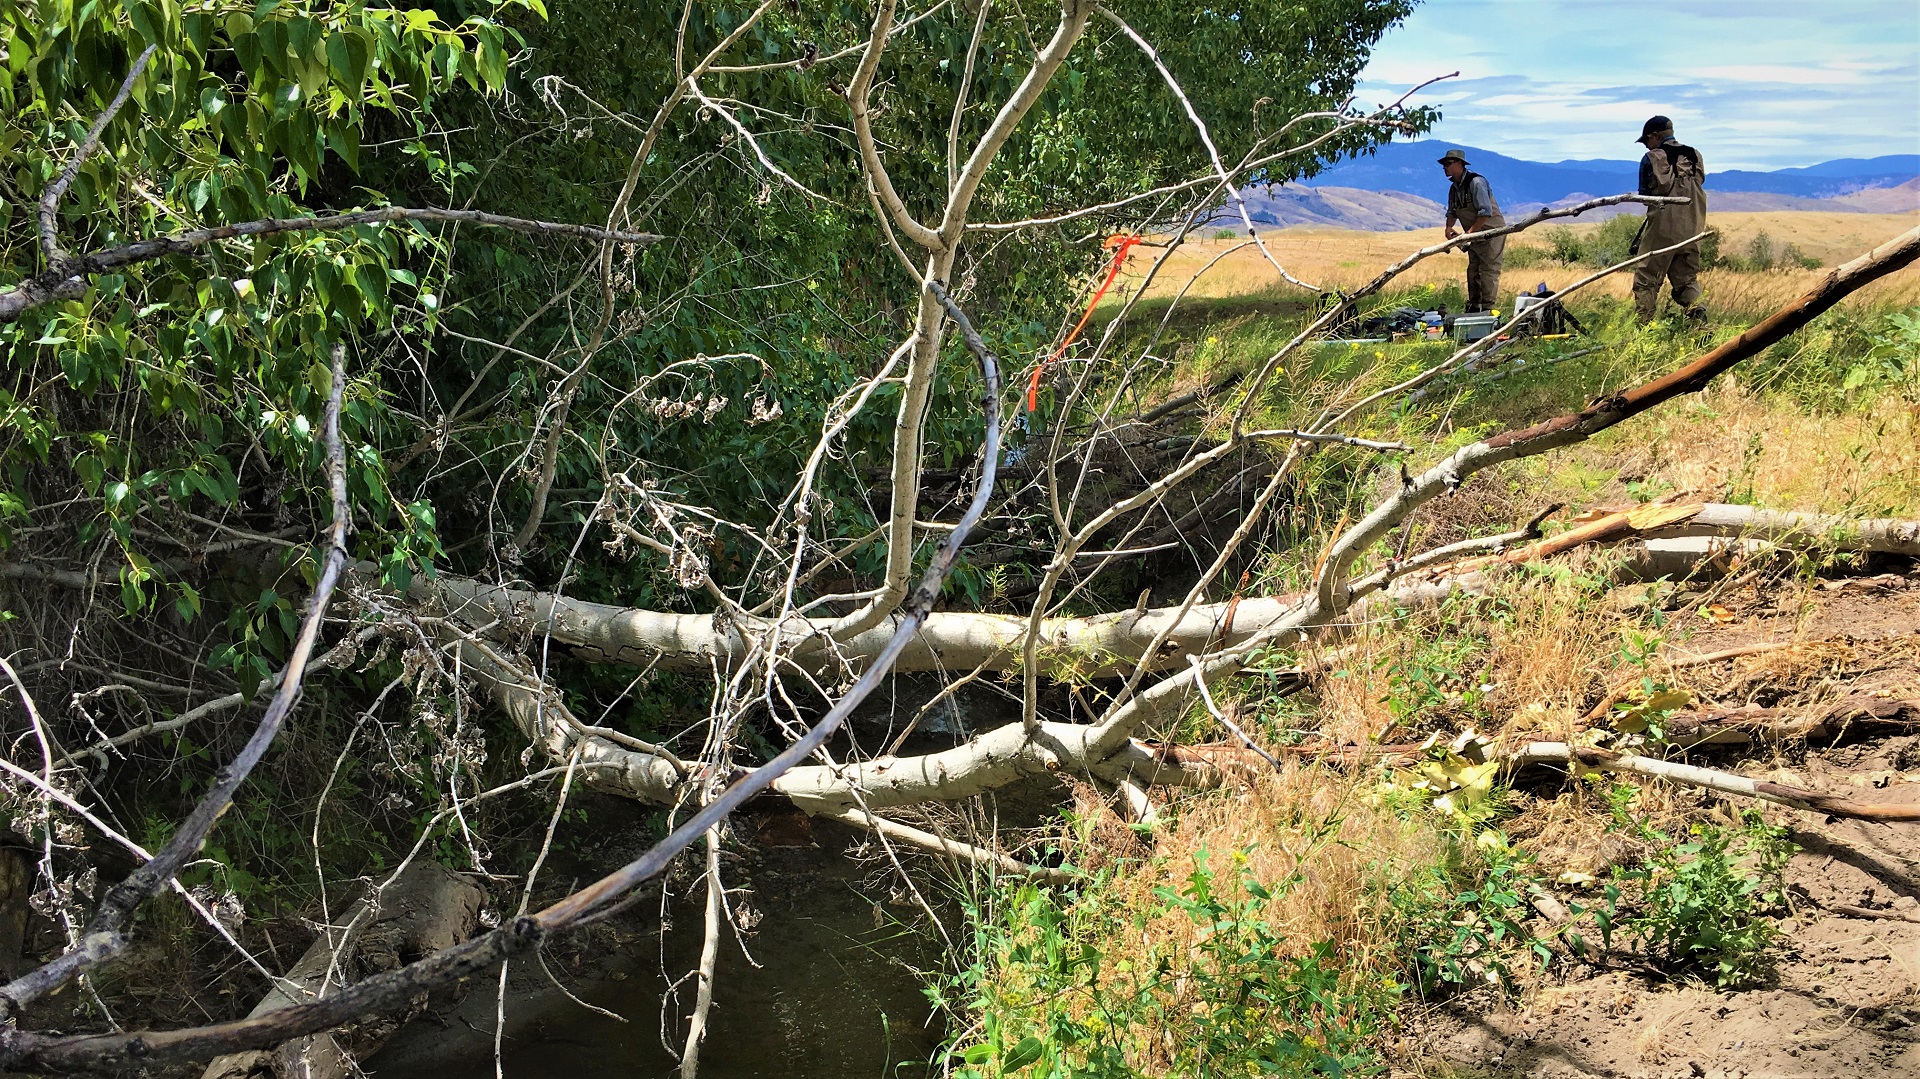
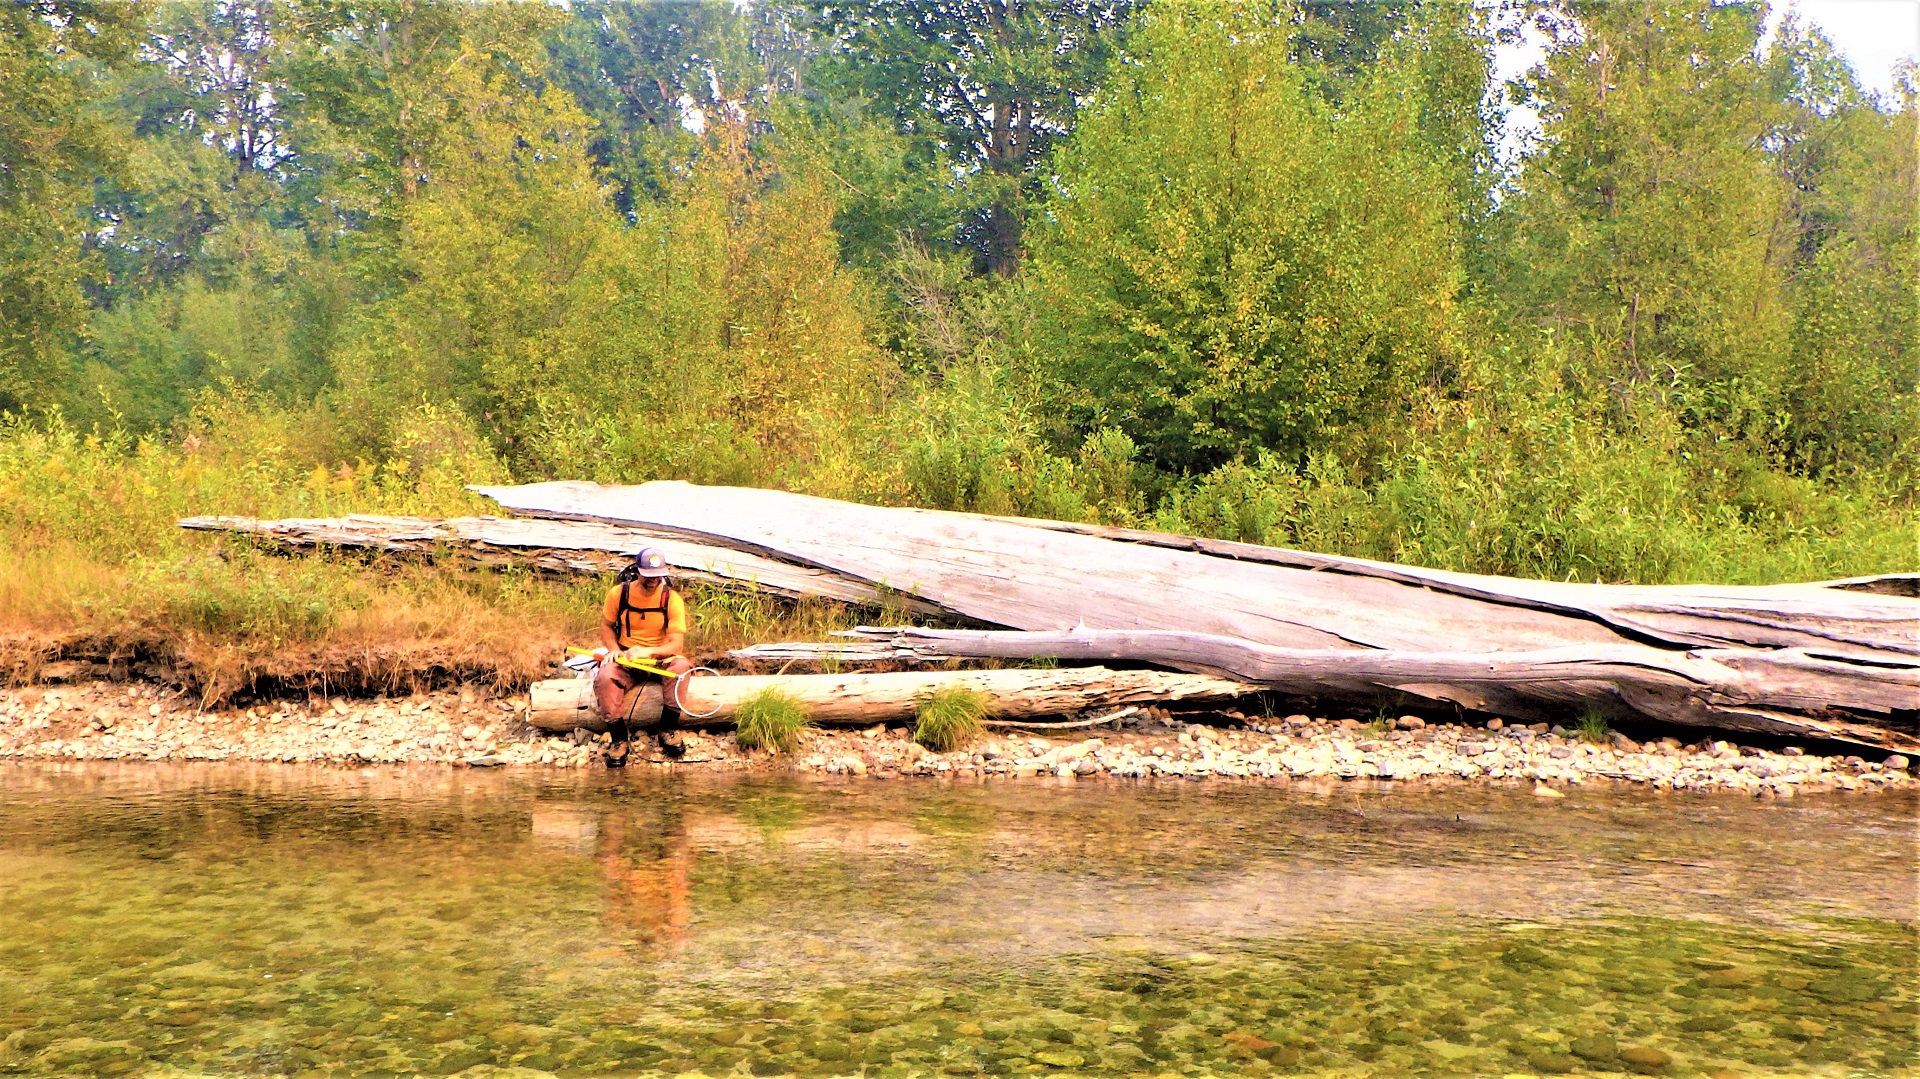
The fishing crew navigates a brushy channel at Antoine Creek.
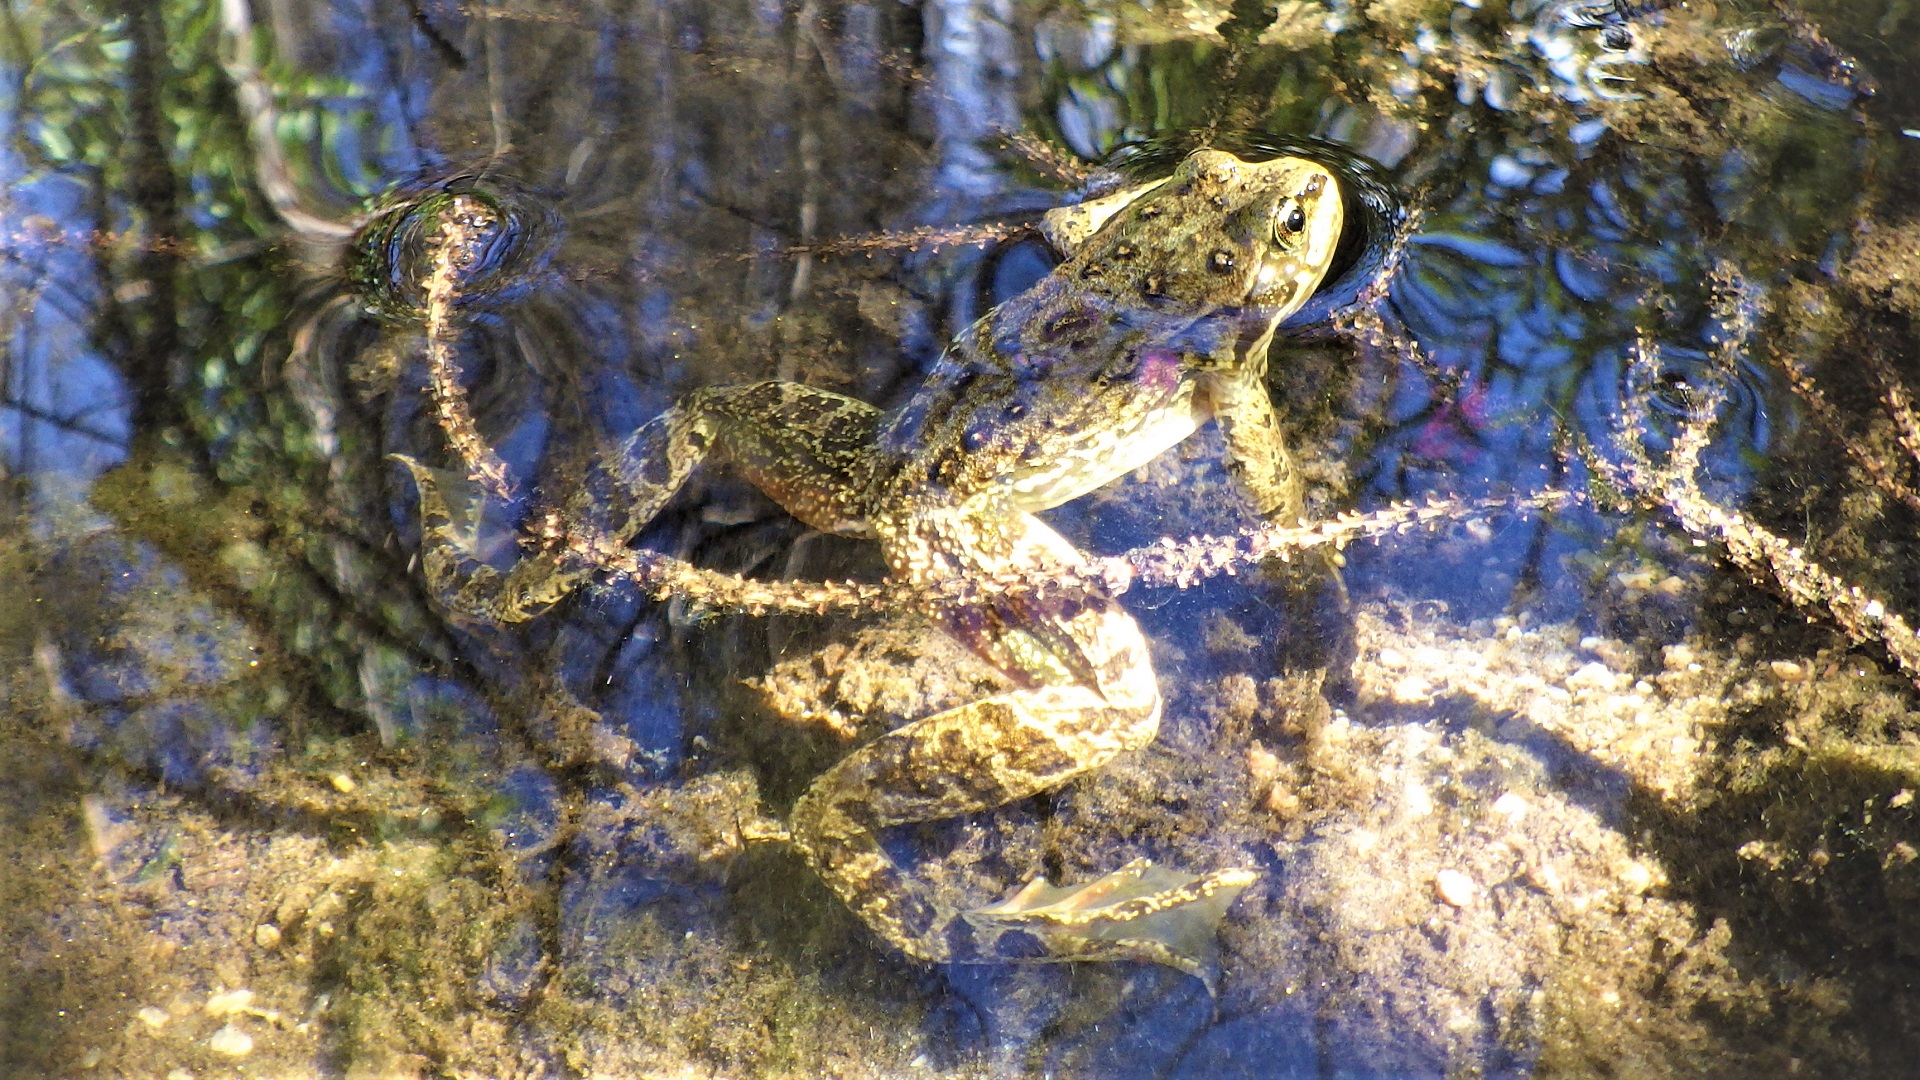
A Columbia spotted frog camouflages in the clean cool water at Depue Creek.
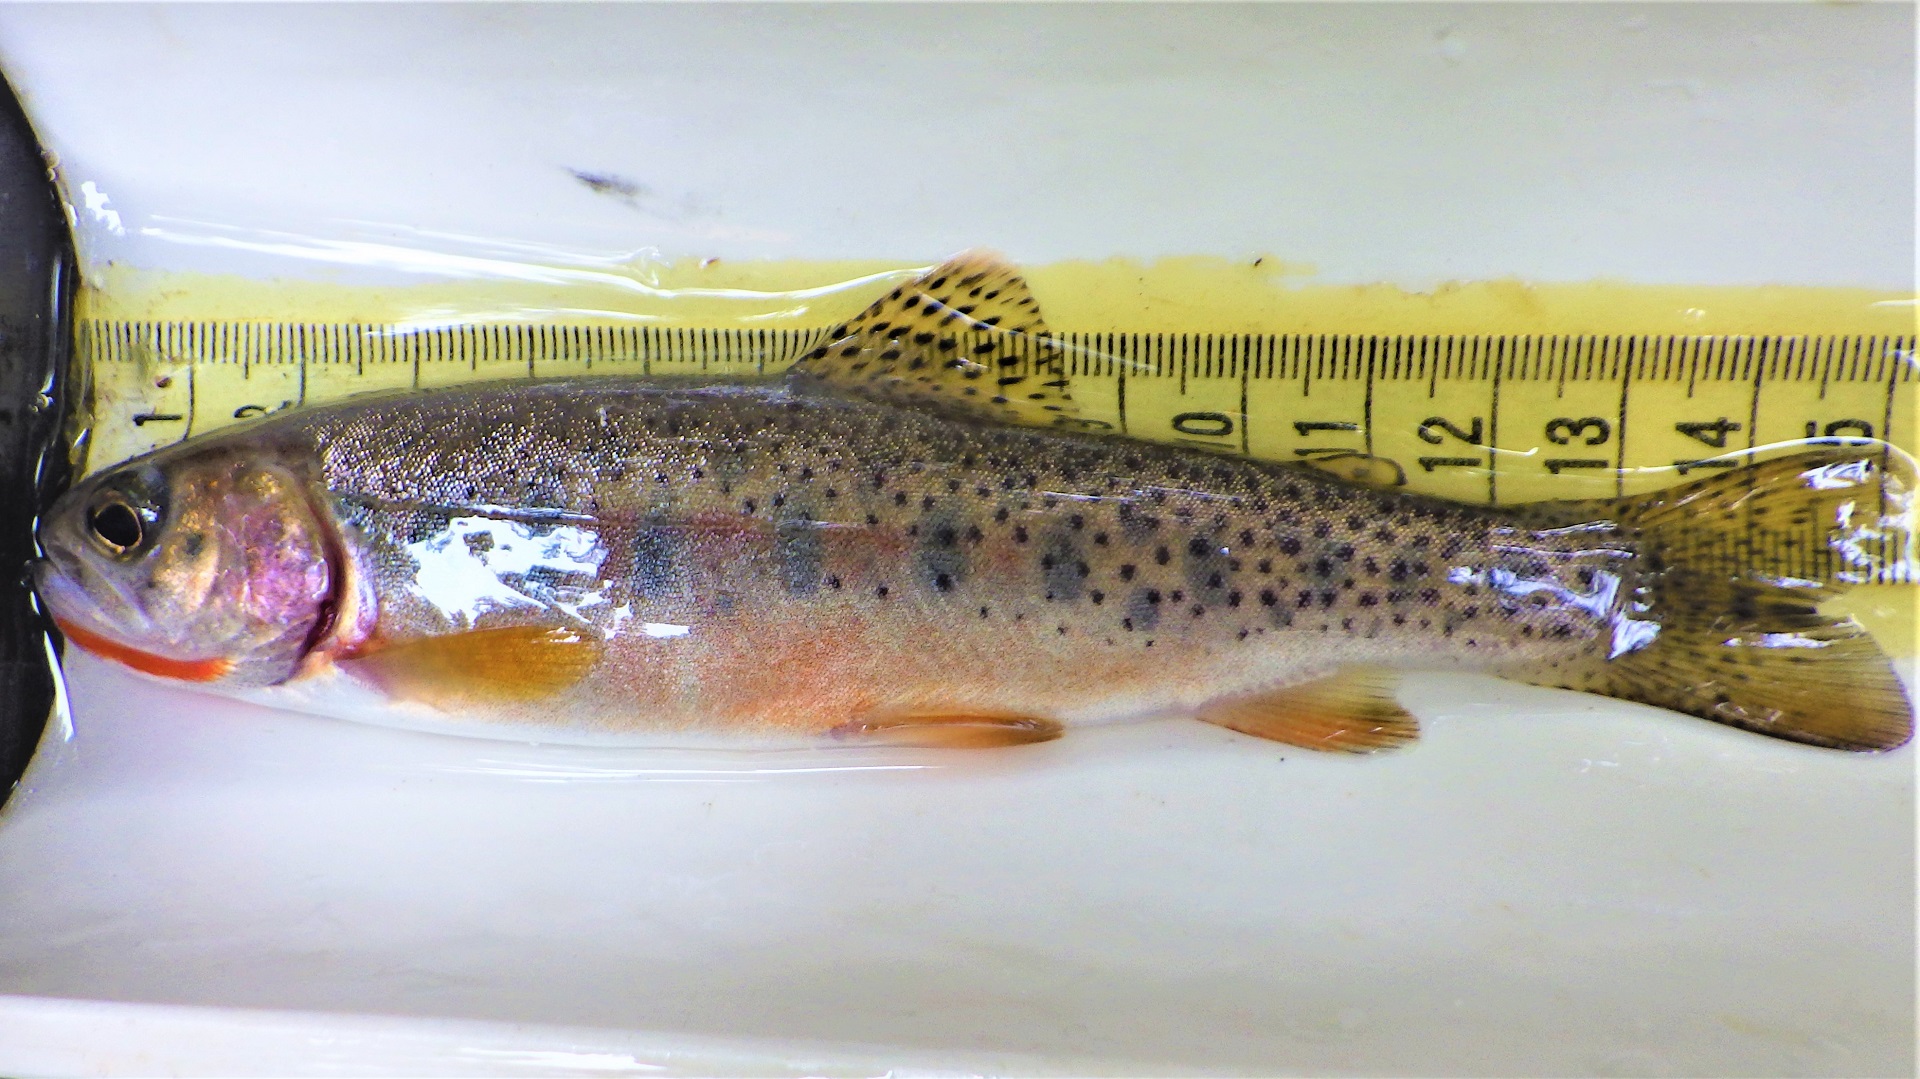
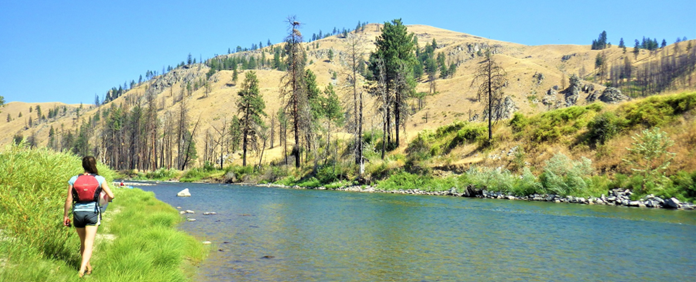
Marble Creek provides cold, clean water for cutthroat trout.
Crews electrofish in the Entiat and other rivers and streams to better understand vertebrate assemblages.
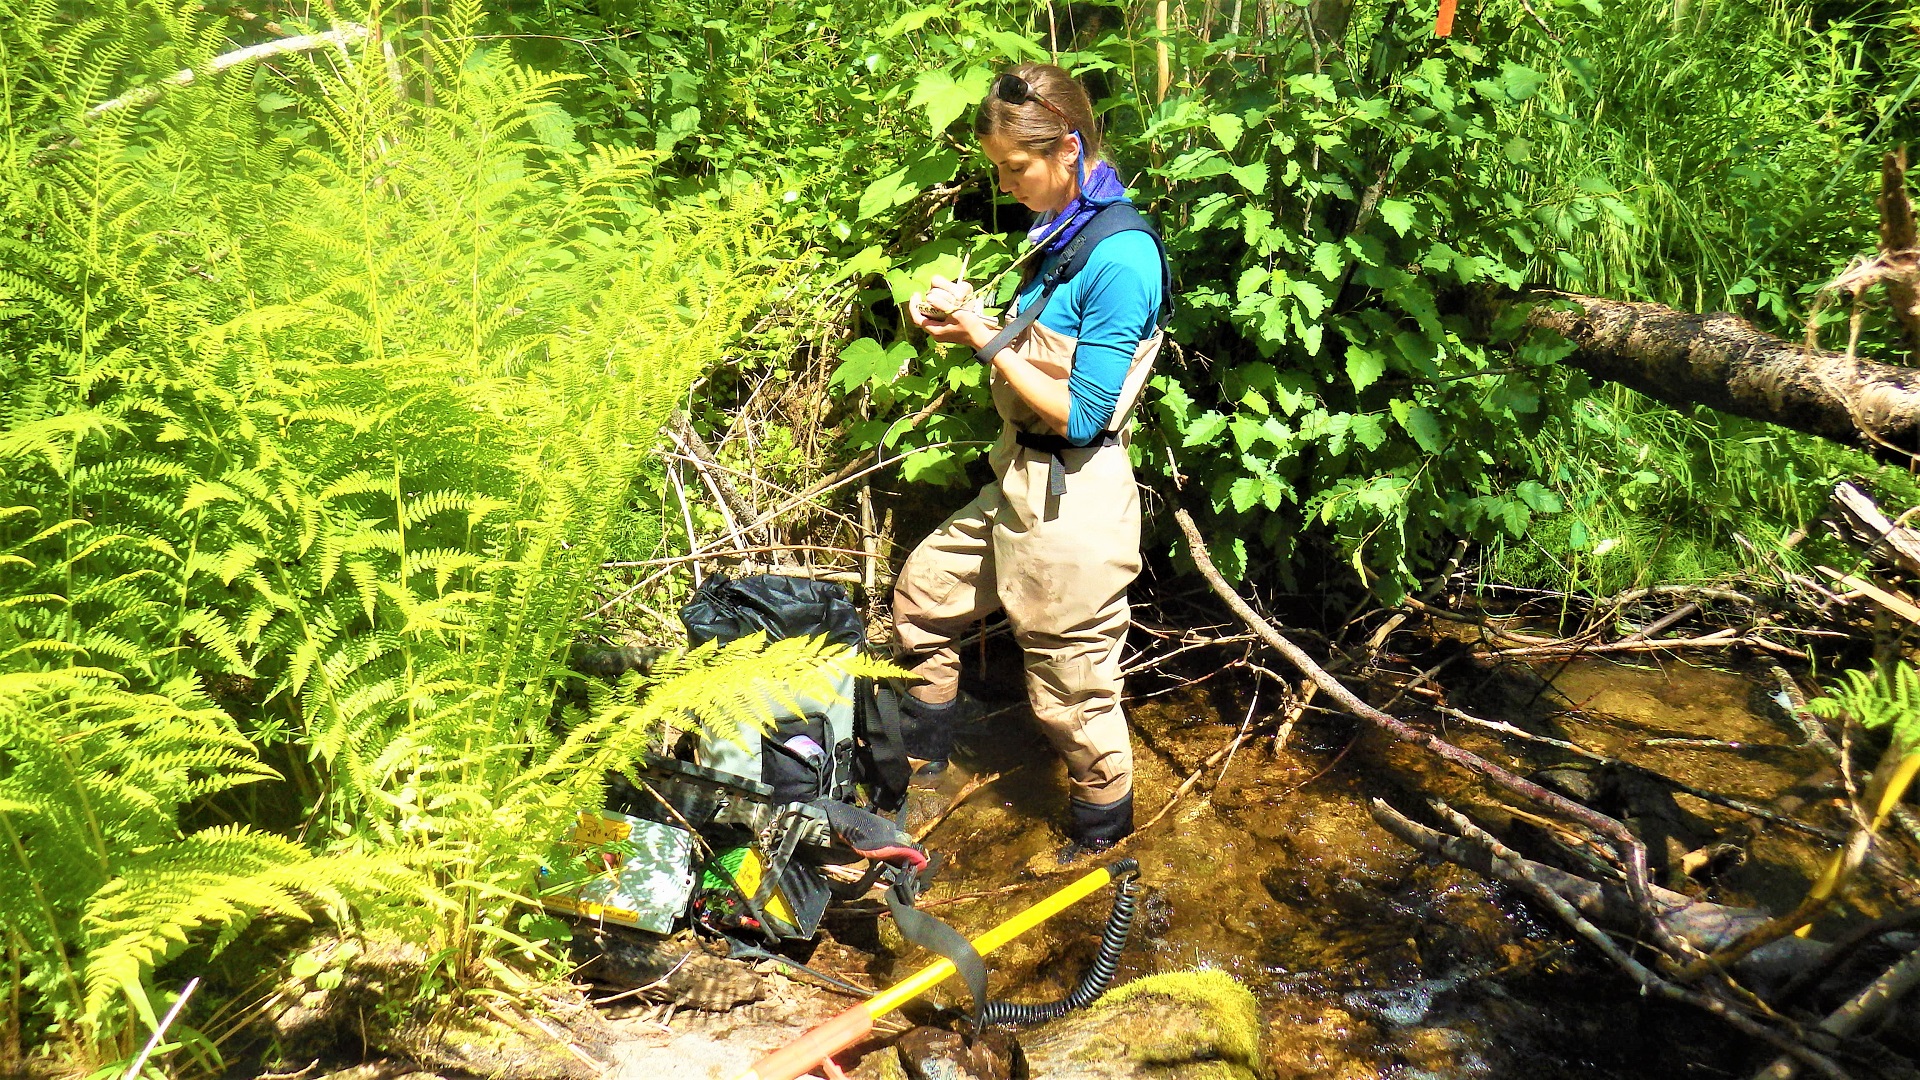
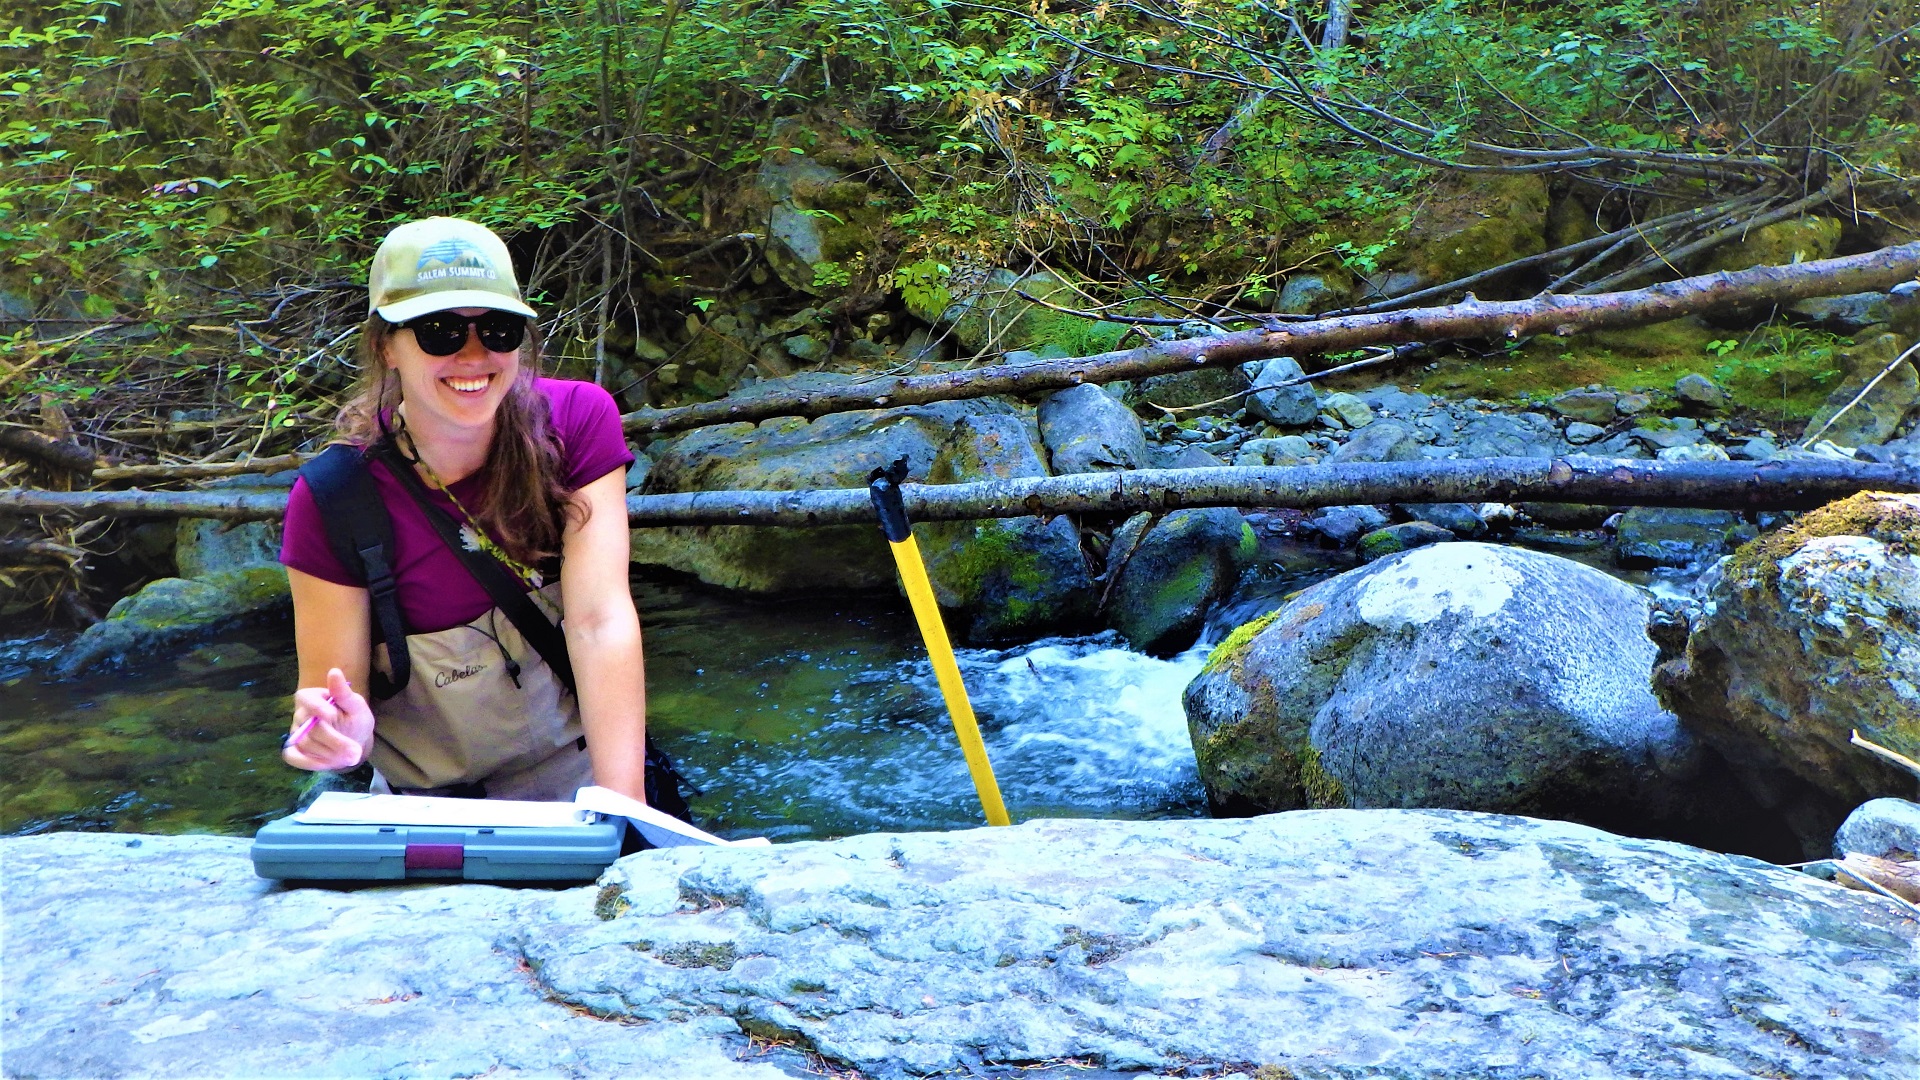
A crewmwmber stops to record notes while electrofishing at Little Loup Loup Creek
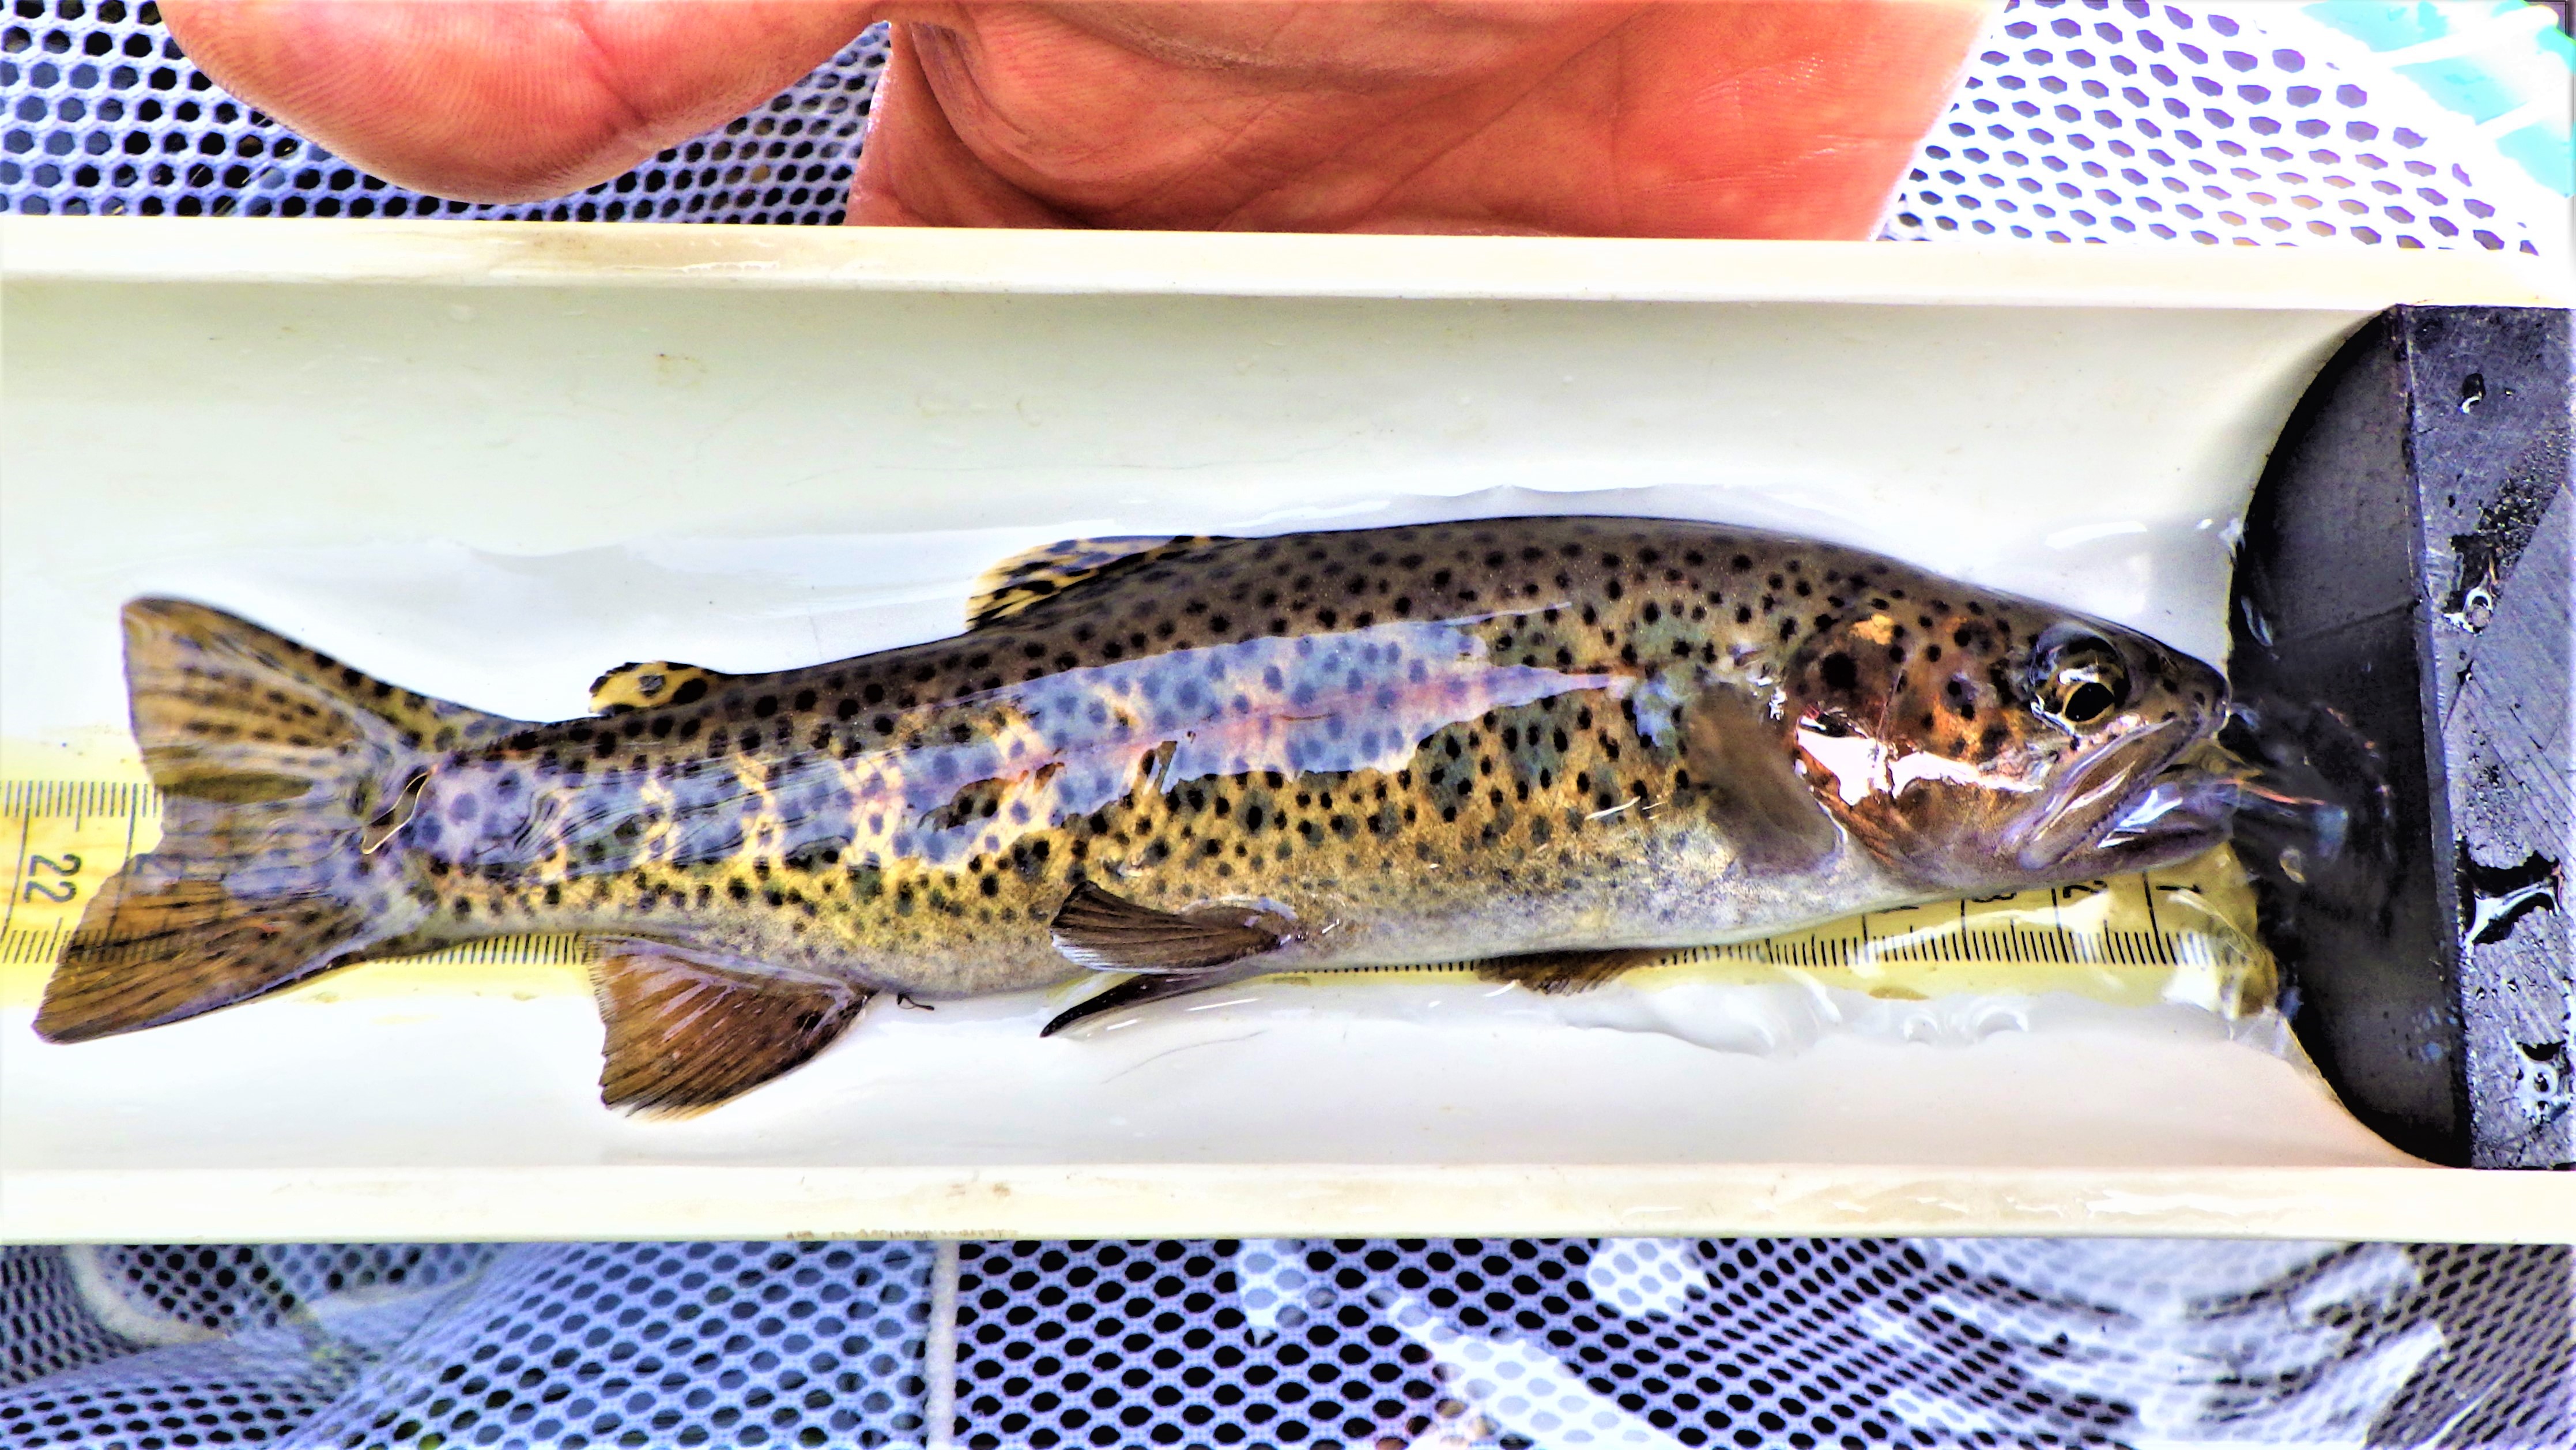
A crewmember caught a beautiful adult rainbow trout in Disappointment Creek.
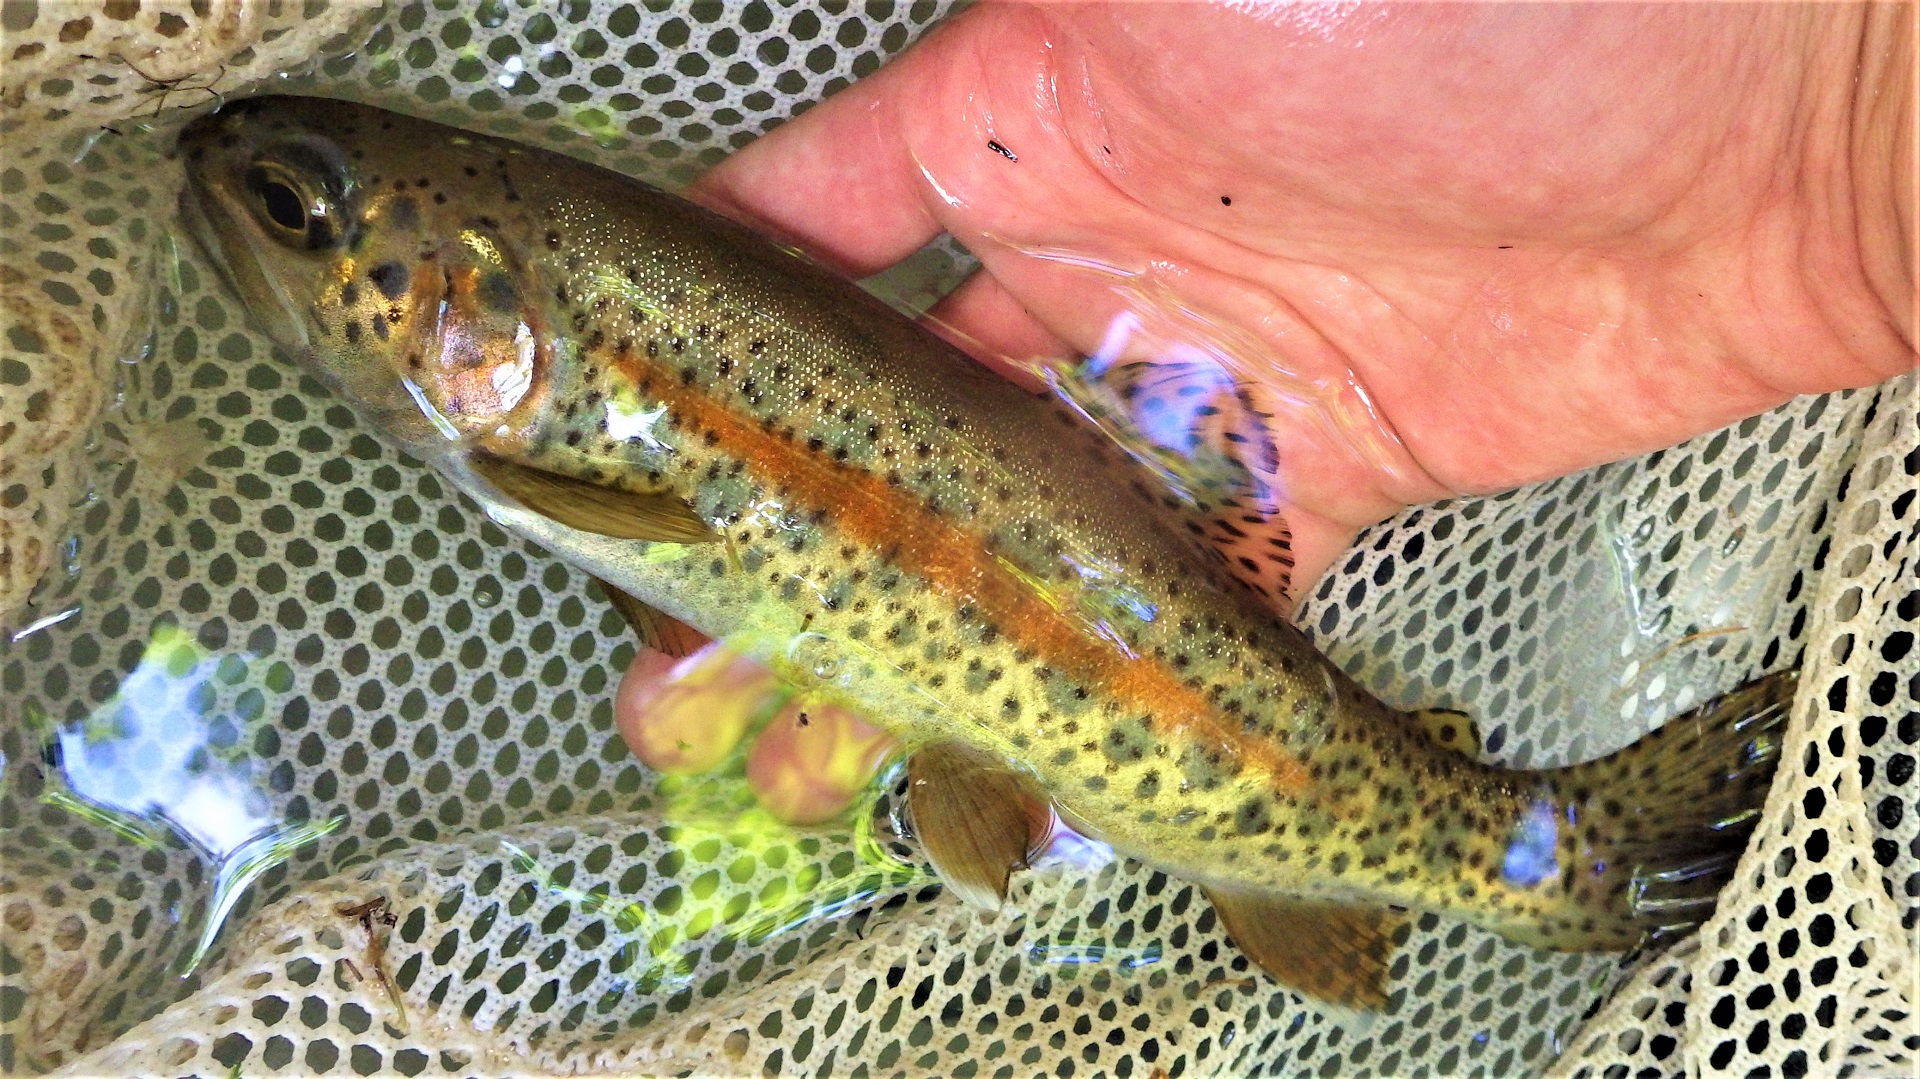
This adult rainbow trout from Sinlahekin Creek is a good indicator of stream health.
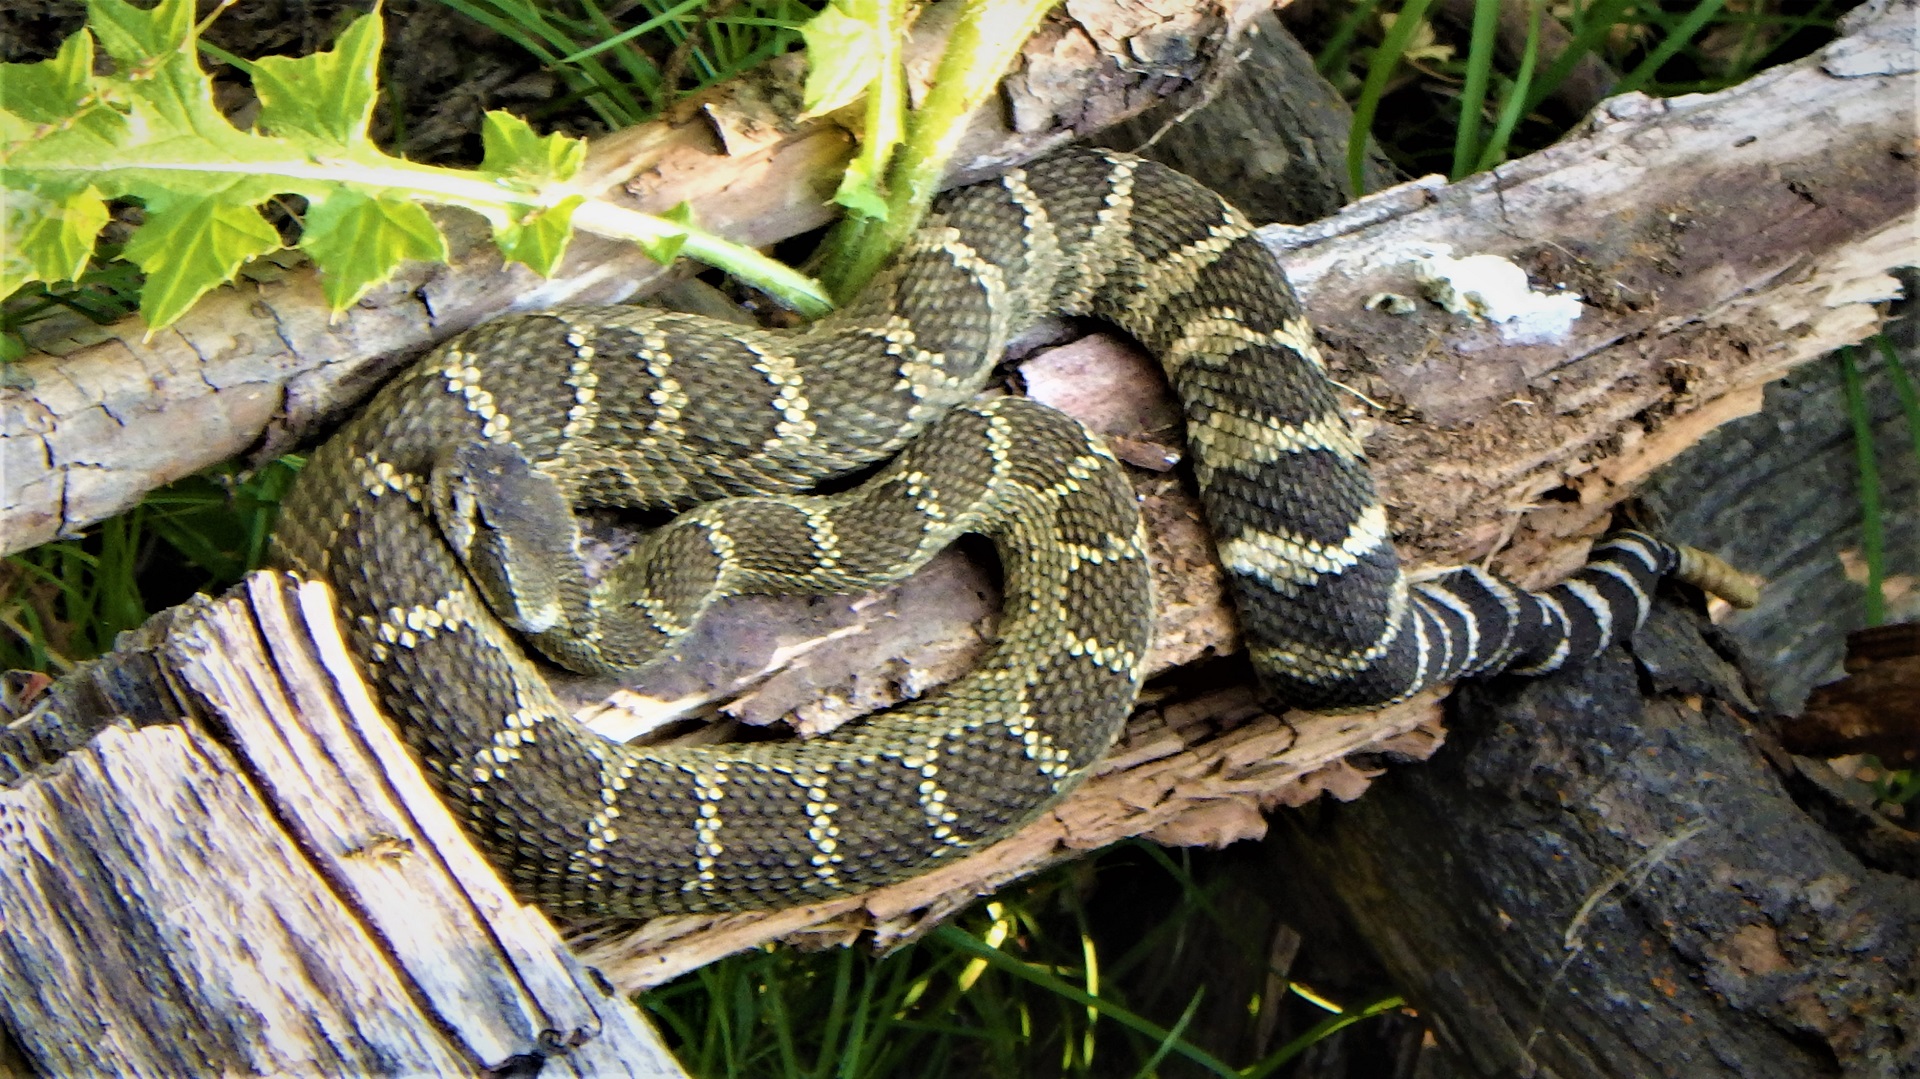
Crews can sometimes run into danger, like when they found this rattlesnake at Rock Island Creek.
Crewmembers draw site diagrams, noting unique features, such as large boulders.
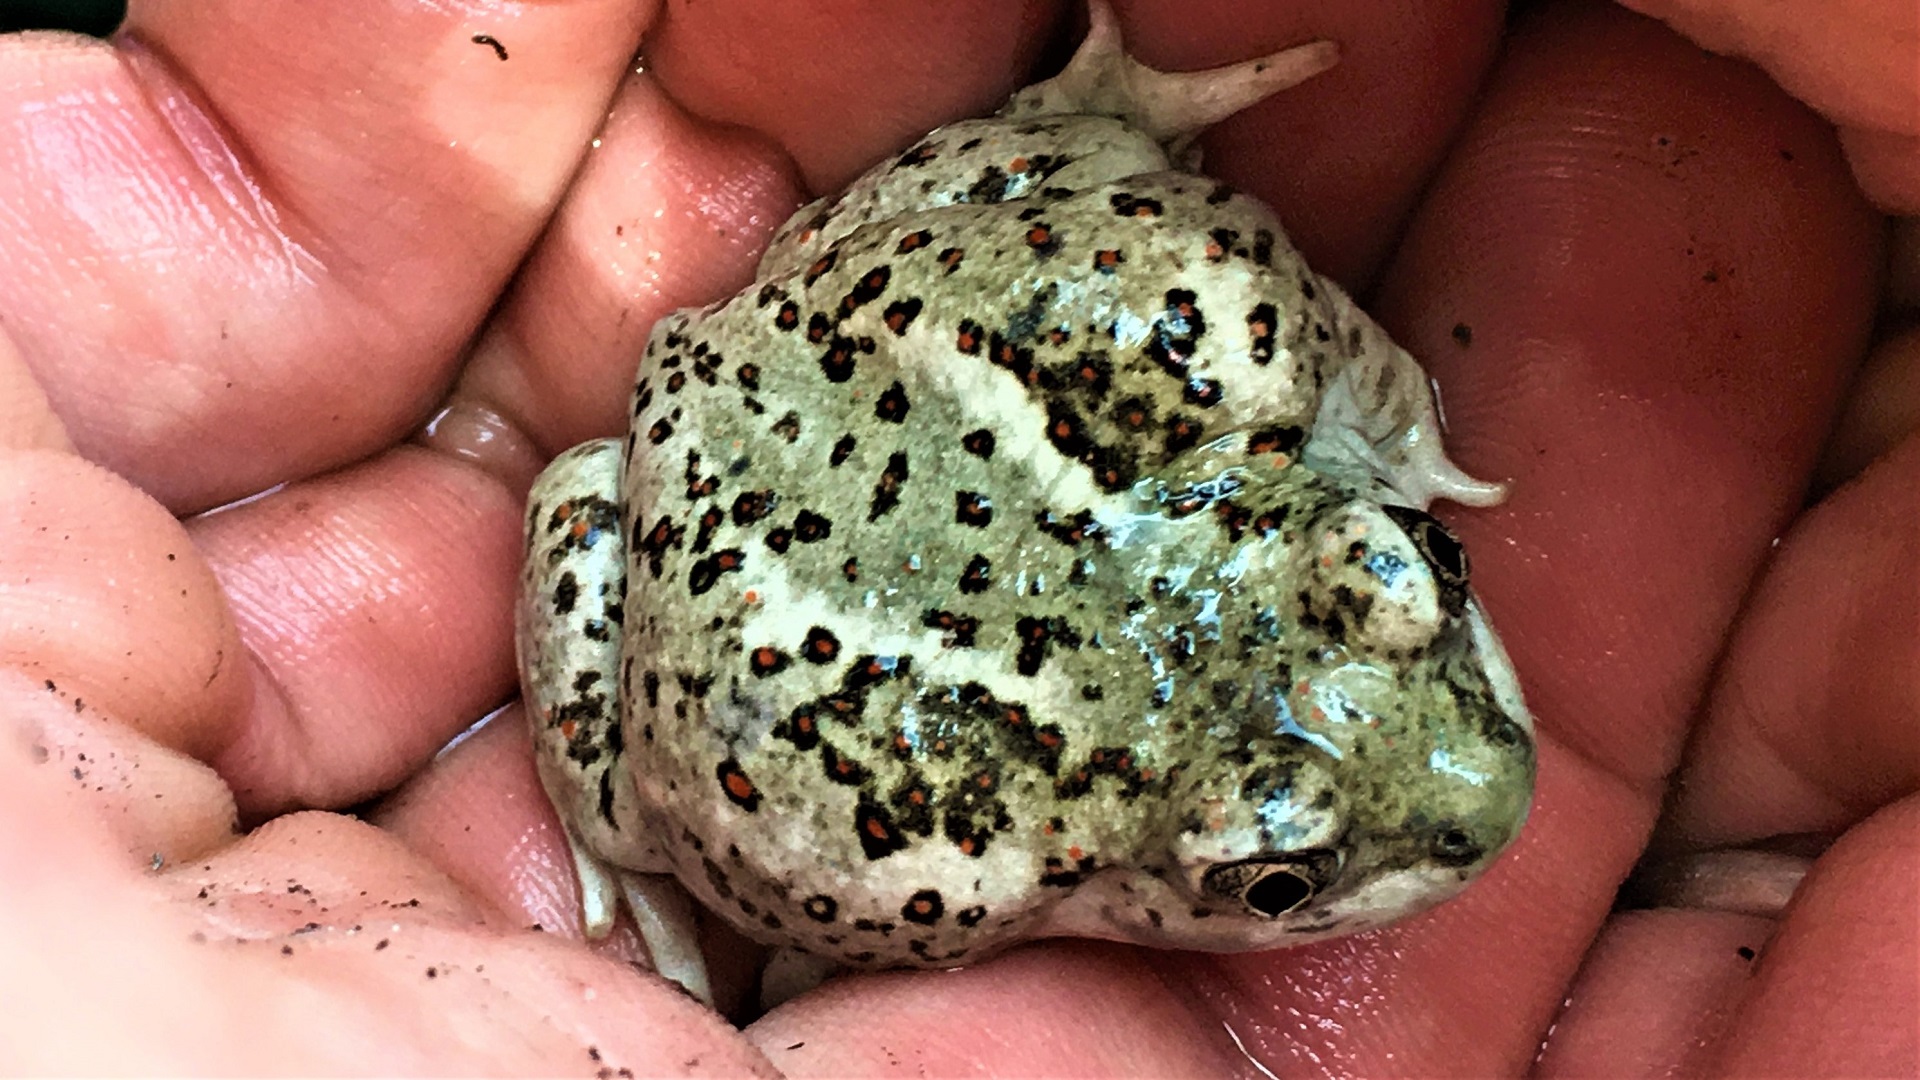
A Great Basin spadefoot from Antoine Creek
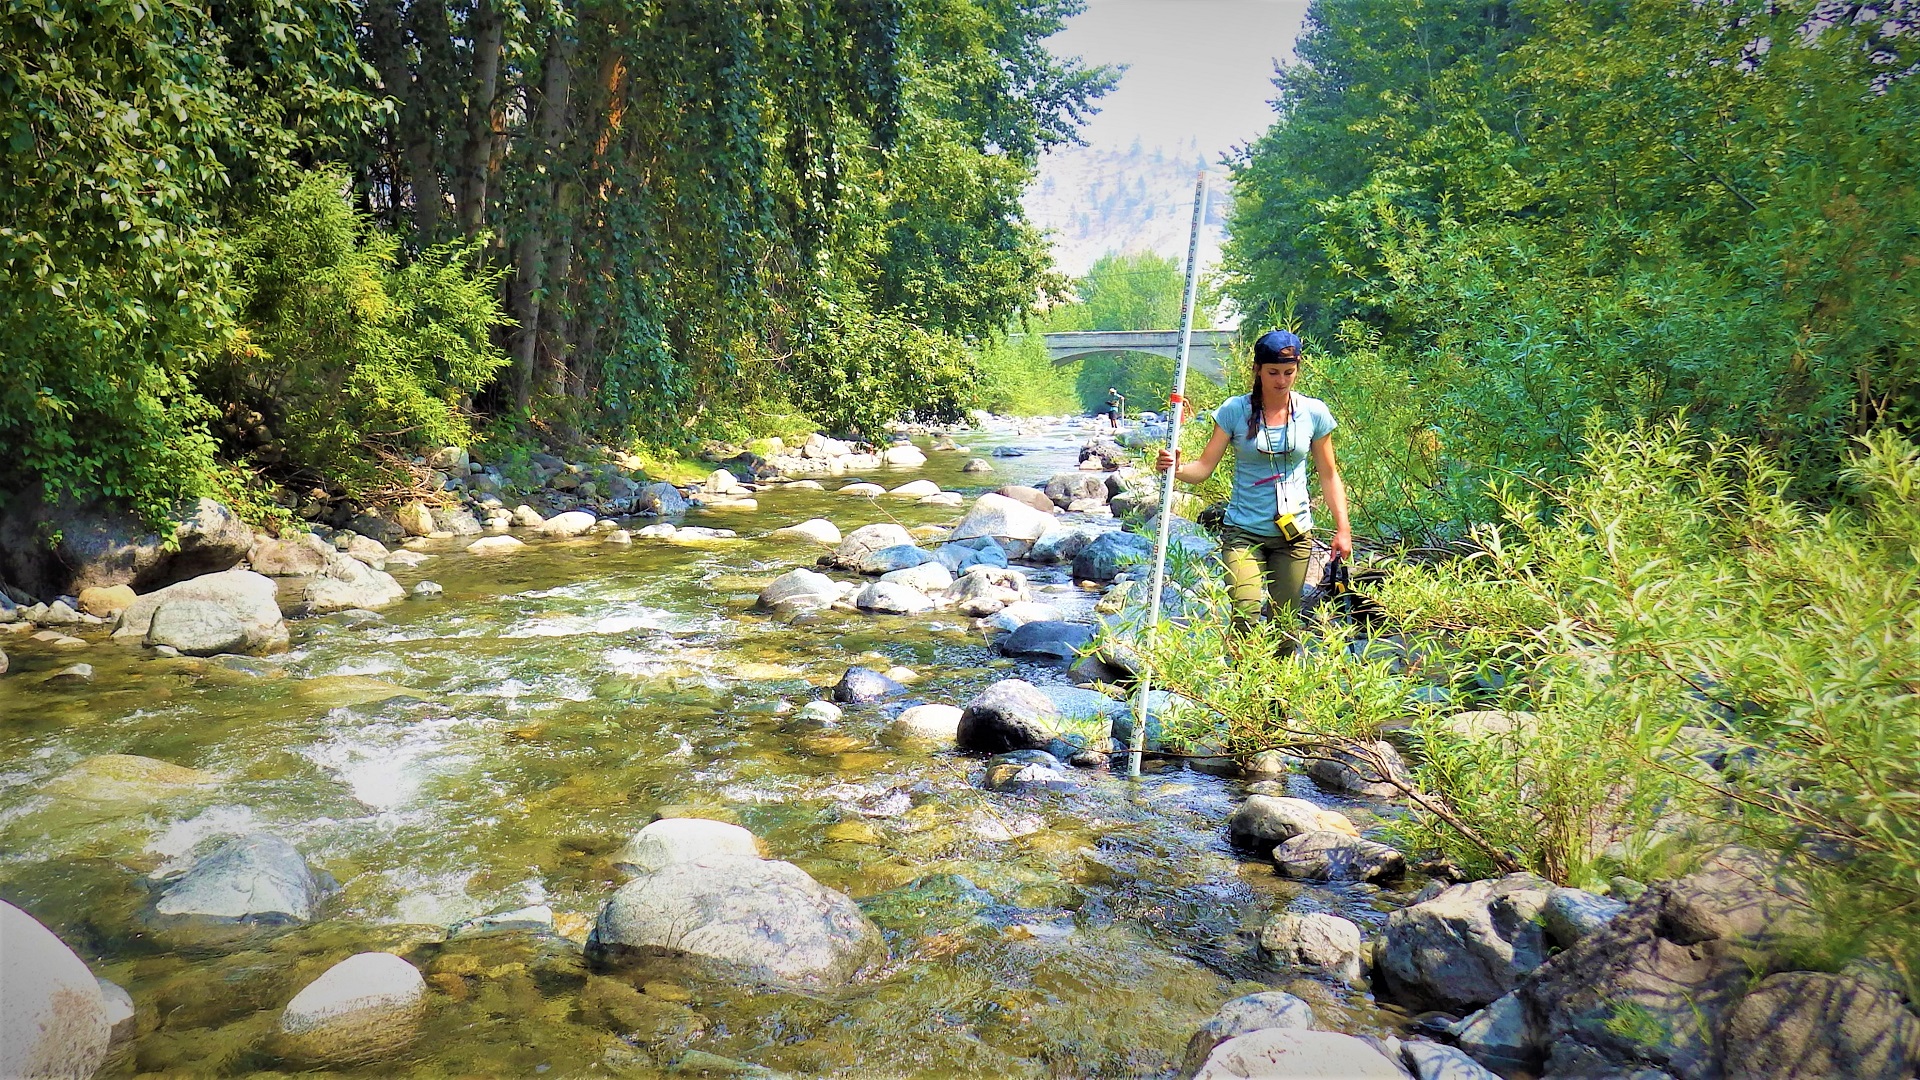
Crews measure many habitat features at Peshastin Creek, including thalweg depths at deepest part of the channel.
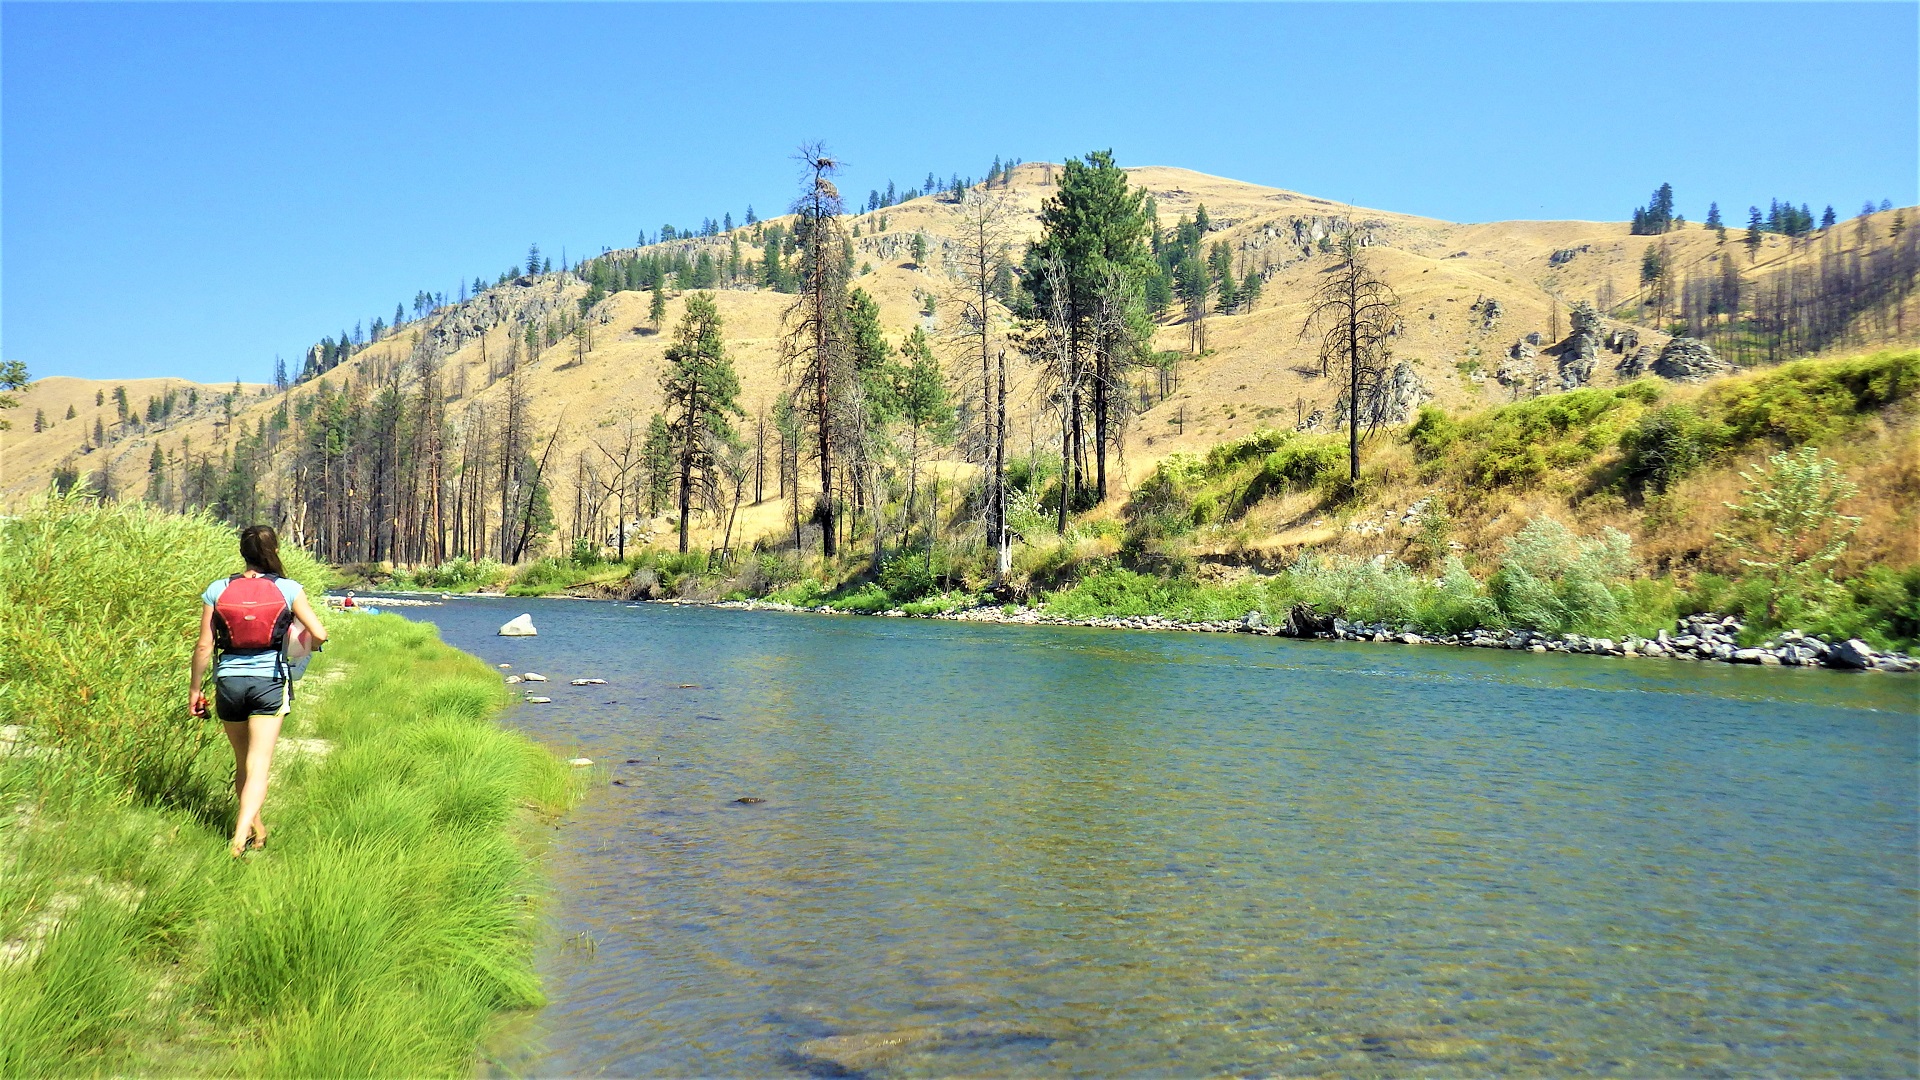
Crews use rafts and a specific wide site protocol on large rivers, such as the Methow.
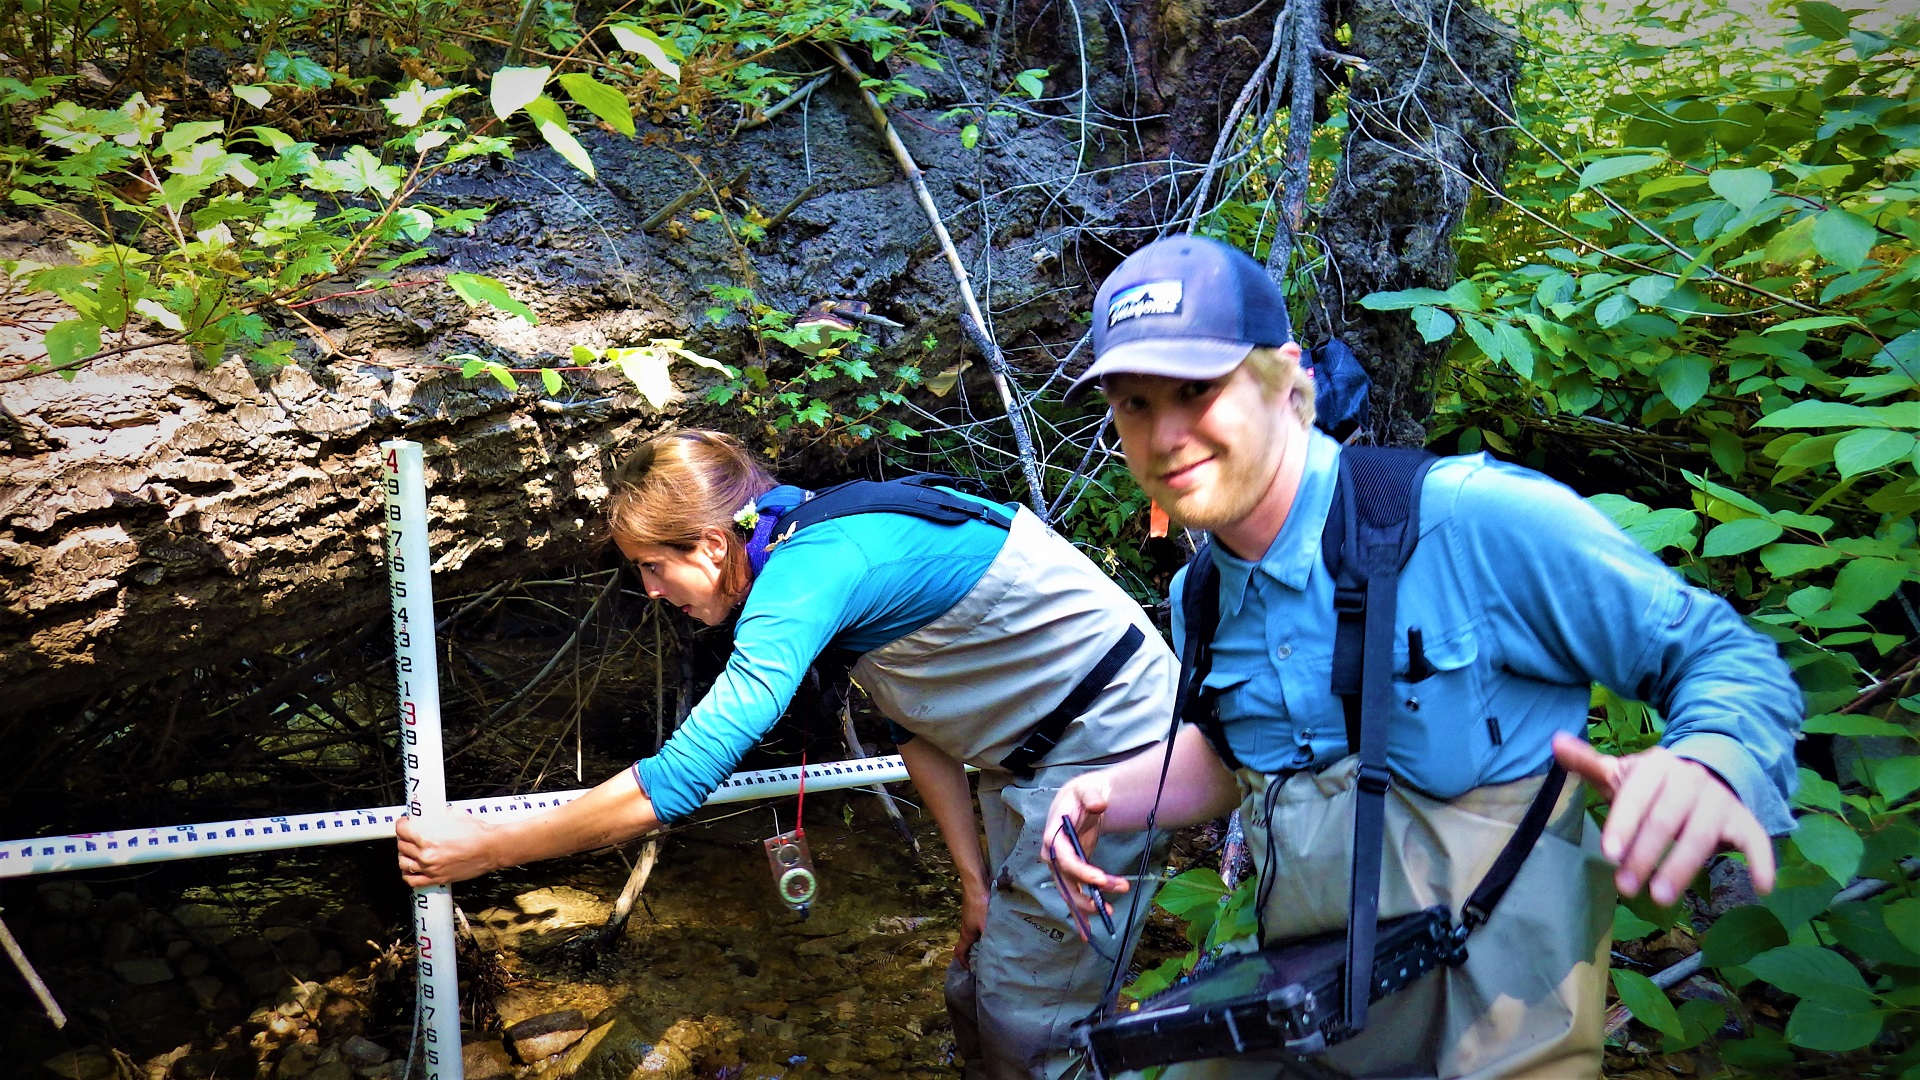
Crewmembers measure and record bankfull height on Bear Creek under a piece of large woody debris.