

Watershed health — Northeast update
We investigated the health of stream habitats in the Northeast Status and Trends Region in 2012 and 2018. Based on these study years, the region showed improving biological condition, with the highest physiochemical stressors involving stream substrate.
Use the map to navigate our reports by Status and Trends Region.
Regional summary
- BIBI scores in the Northeast Region show potential improvement in 2018 compared to 2012, with higher and lower proportion of streams in good and poor conditions, repsectively.
- The most prevalent stressors for streams in the Northeast Region were poor bed stability, increased sand/fines substrates, increased substrate embeddedness, and increased stream temperature.
Biological condition
Invertebrate biological condition of streams, as assessed with B-IBI scores, did not change significantly from 2012 to 2018 in the Northeastern Region. However, the proportion of streams in poor condition decreased, and the proportion of streams in good condition increased. The percentage of streams in fair condition remained the same.
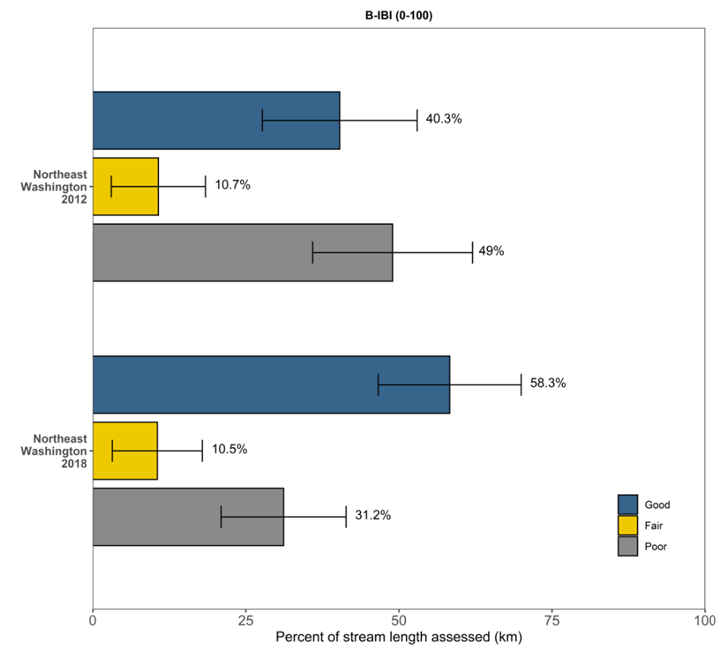
We used B-IBI ratings in 2012 and 2018 to rate percentages of stream kilometers in the Northeast Region as good, fair, or poor. Error bars represent 95% confidence intervals.
Significant physical and chemical stressors
In the Northeast Region, some of the most prevalent stressors were those associated with stream substrate, namely bed stability, percentage of sand/fines and substrate embeddedness. Most of the stream kilometers assessed showed low bed stability and elevated sand/fines percentages. High water temperatures were also prevalent in the Northeast Region. Canopy cover and natural fish cover decreased, although results were not significant. Other parameters that indicated potential change in 2018 compared to 2012 include increased nitrogen and elevated pH.
To interact with this graph and learn more about these stressors, hold your mouse over each bar.
This interactive graph shows the percentage of stream kilometers assessed with poor physiochemical conditions in the Northeast Region for 2012 and 2018. The x-axis represents the percentage of river extent in poor condition. Error bars show 95% confidence intervals.
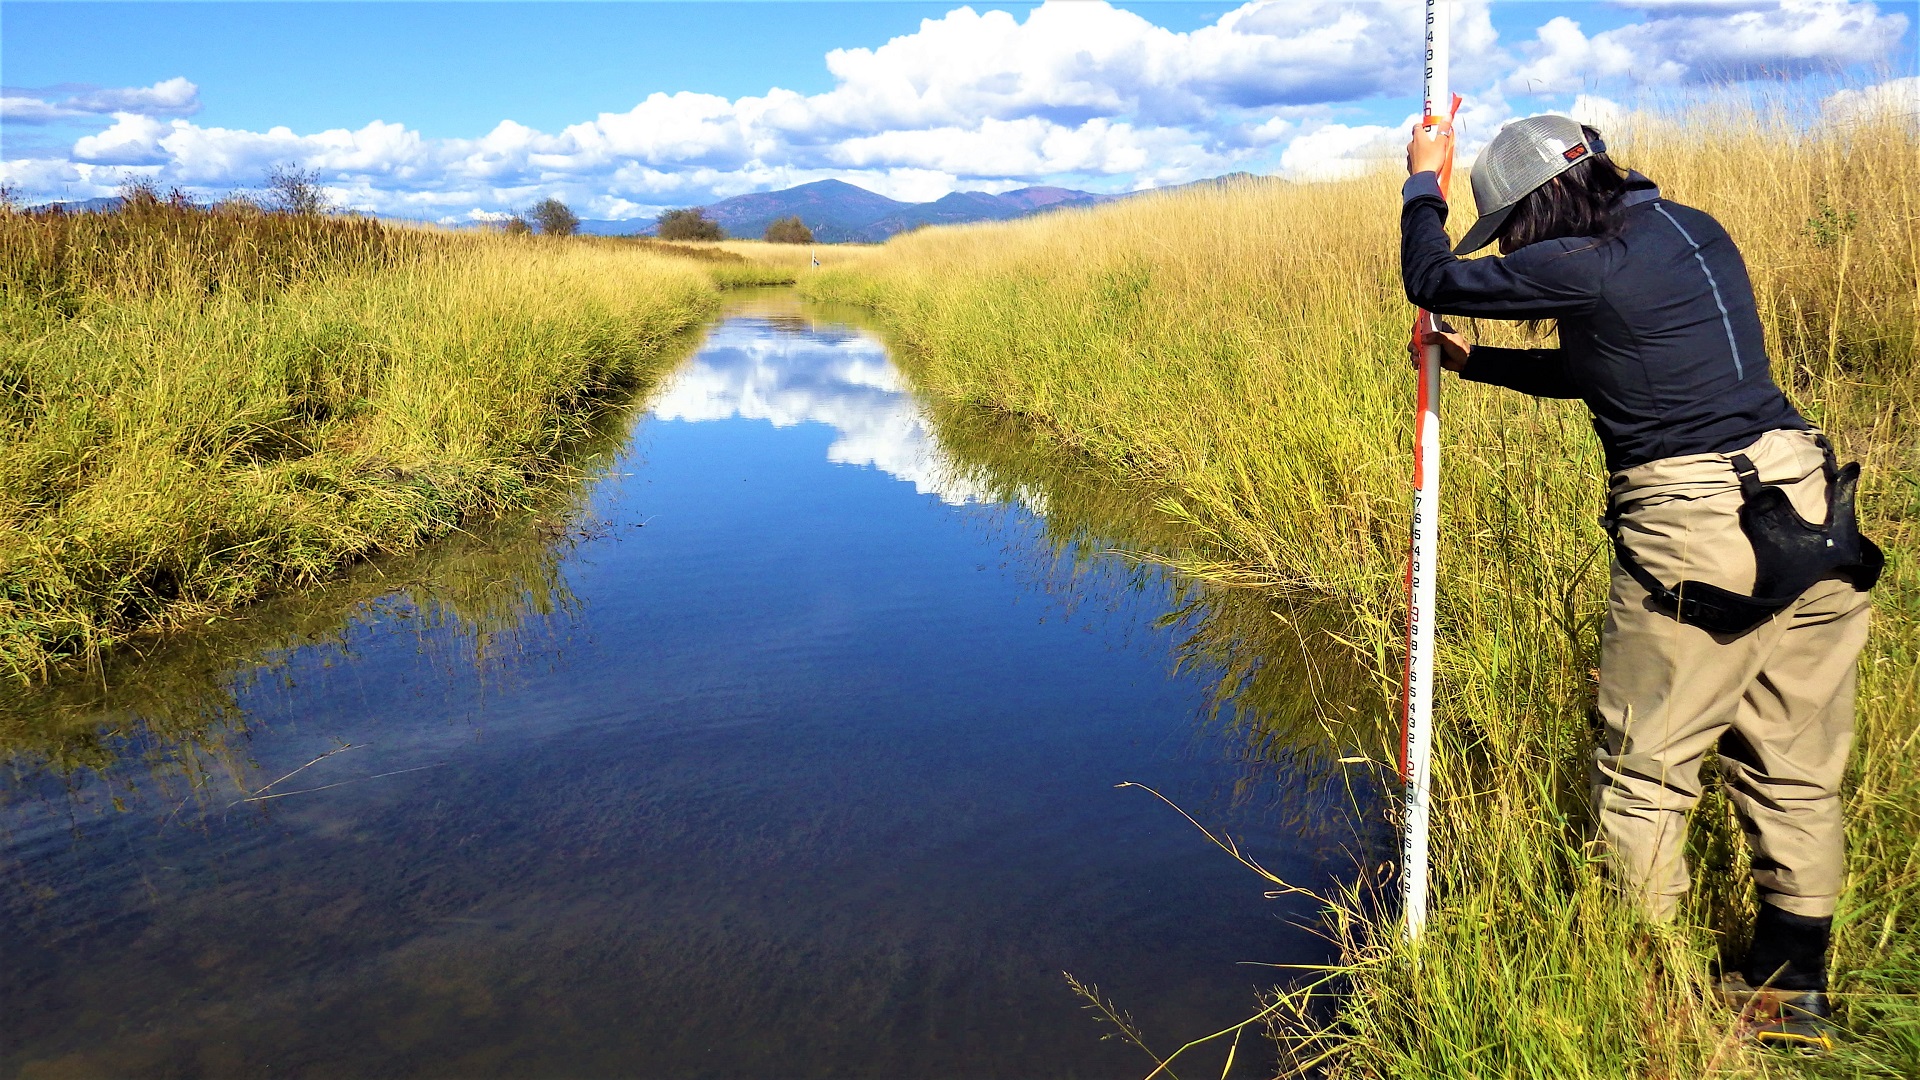
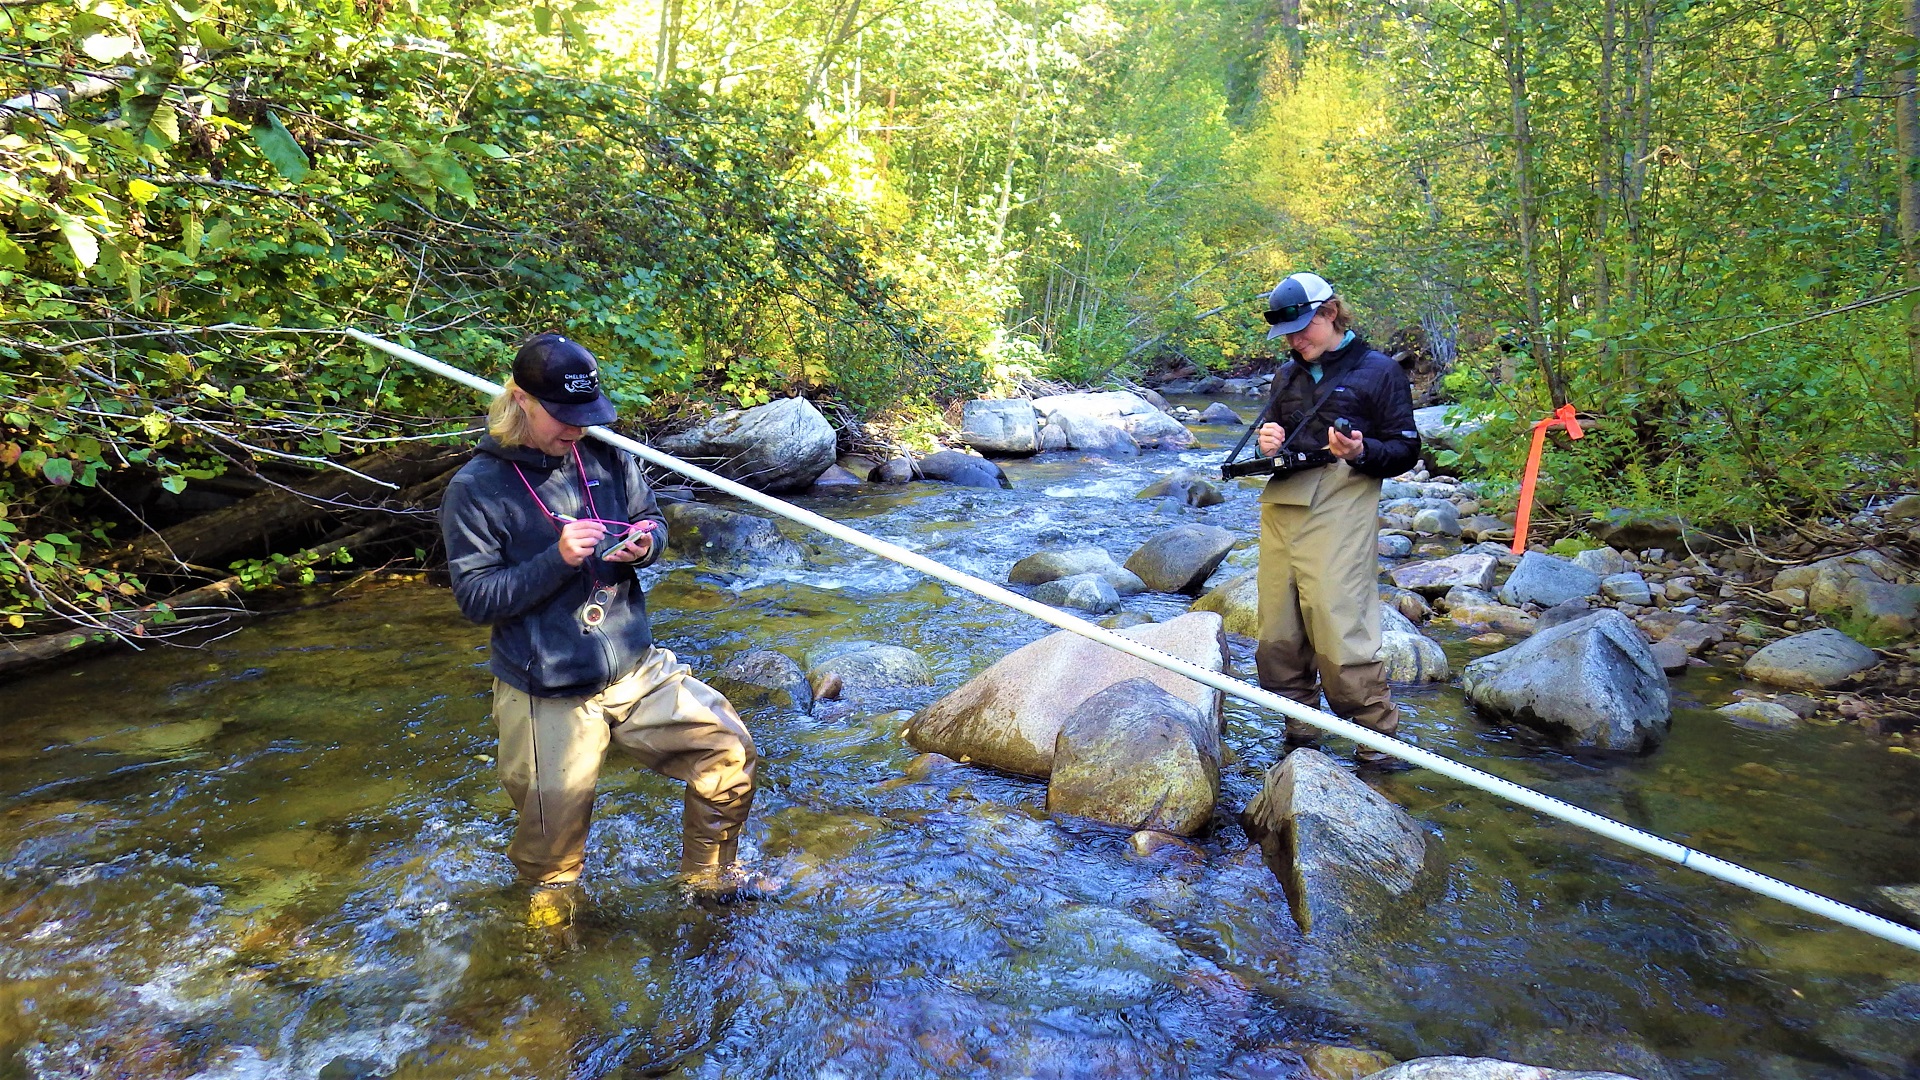
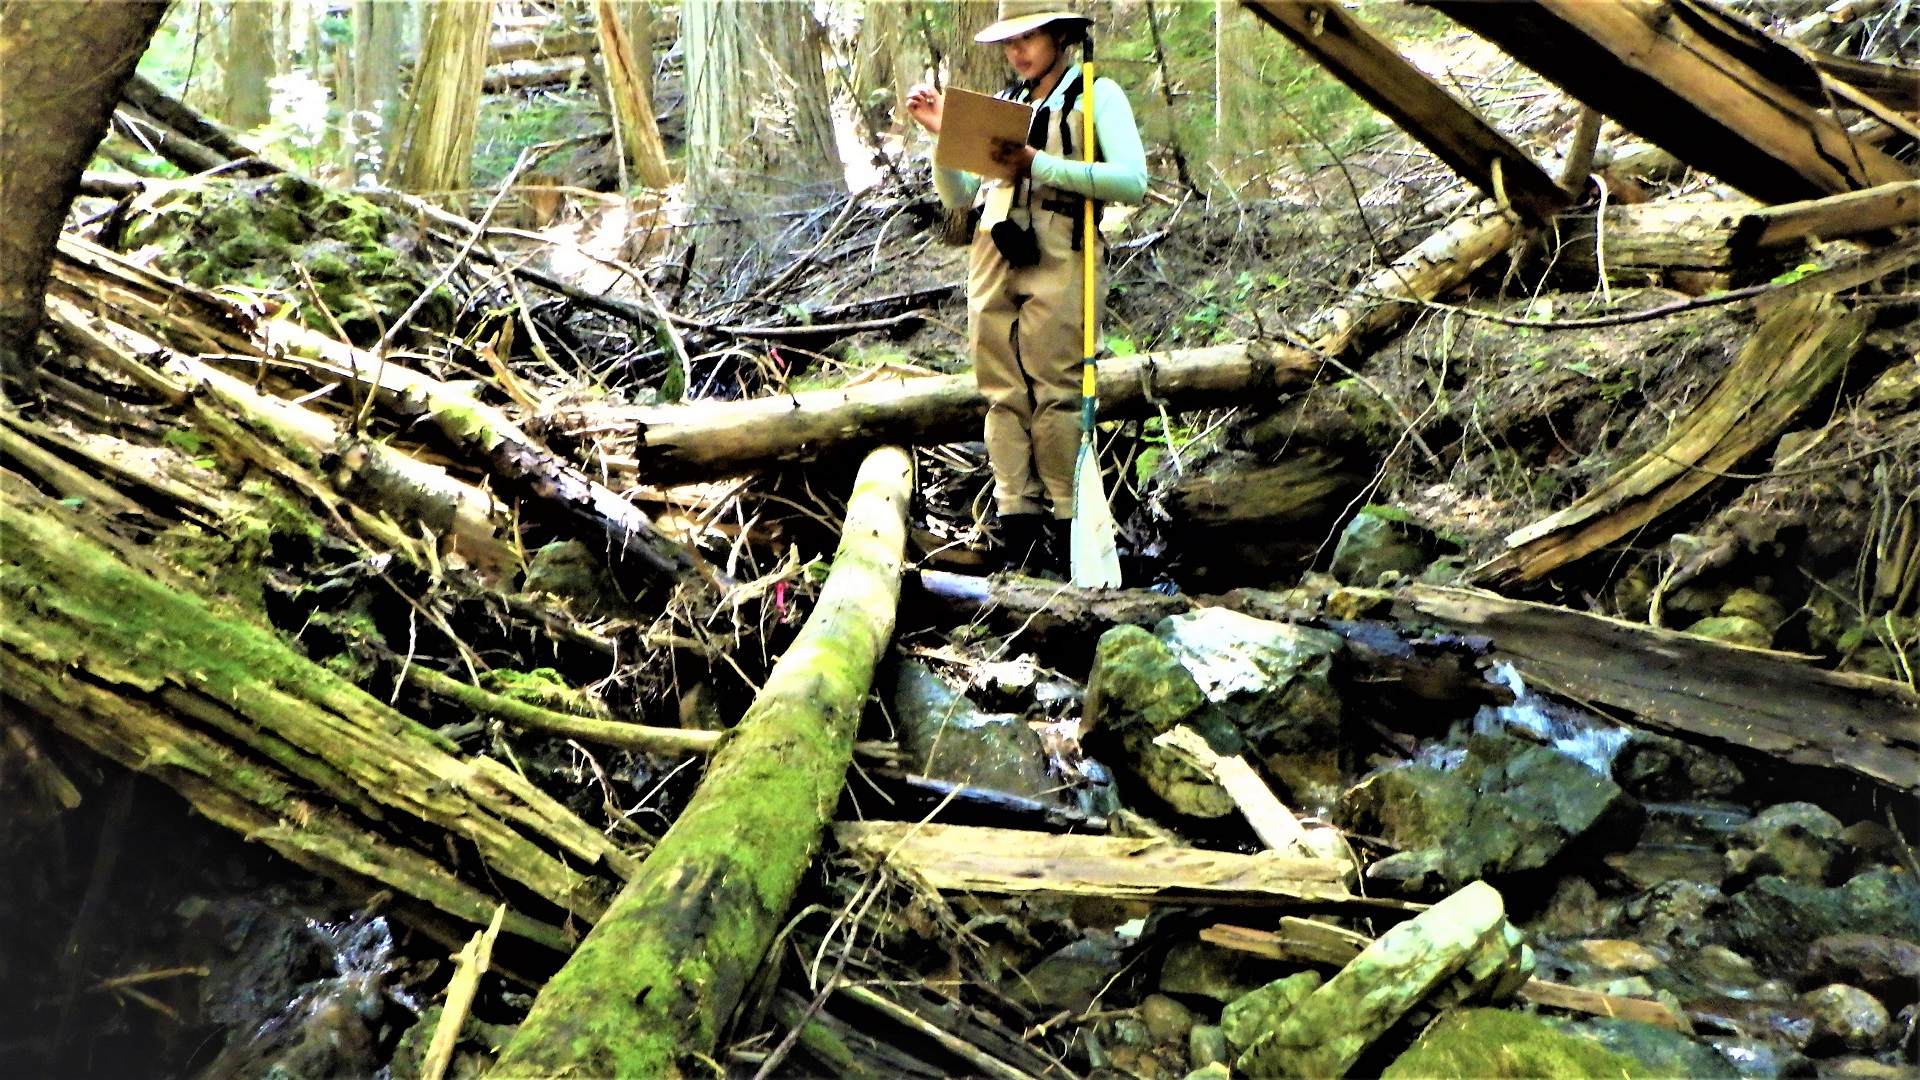
Measuring bankfull heights at Small Creek in Pend Oreille County
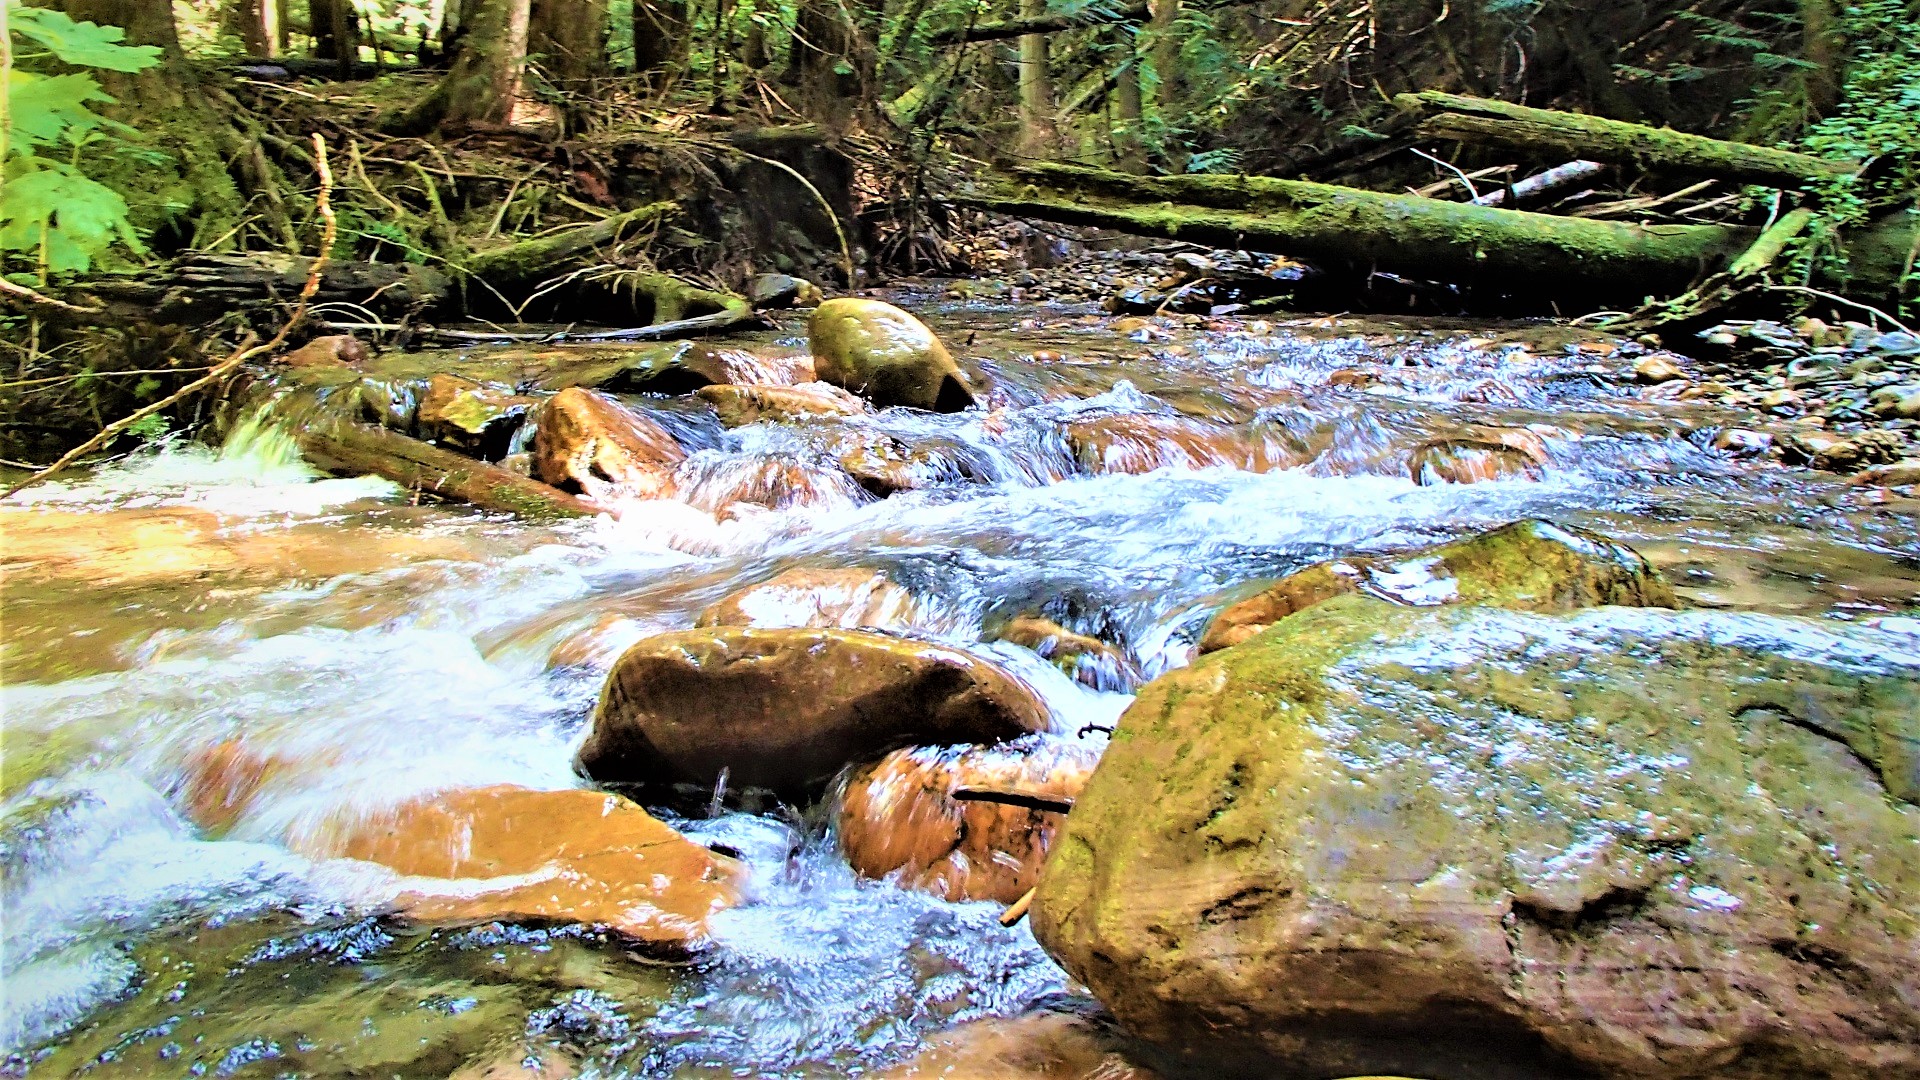
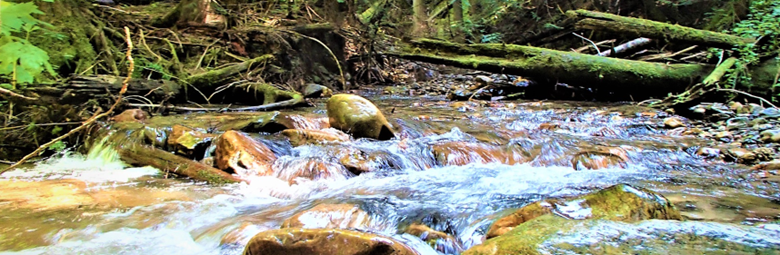
Cold, swift water and boulders support fish health and habitat at Sullivan Creek.
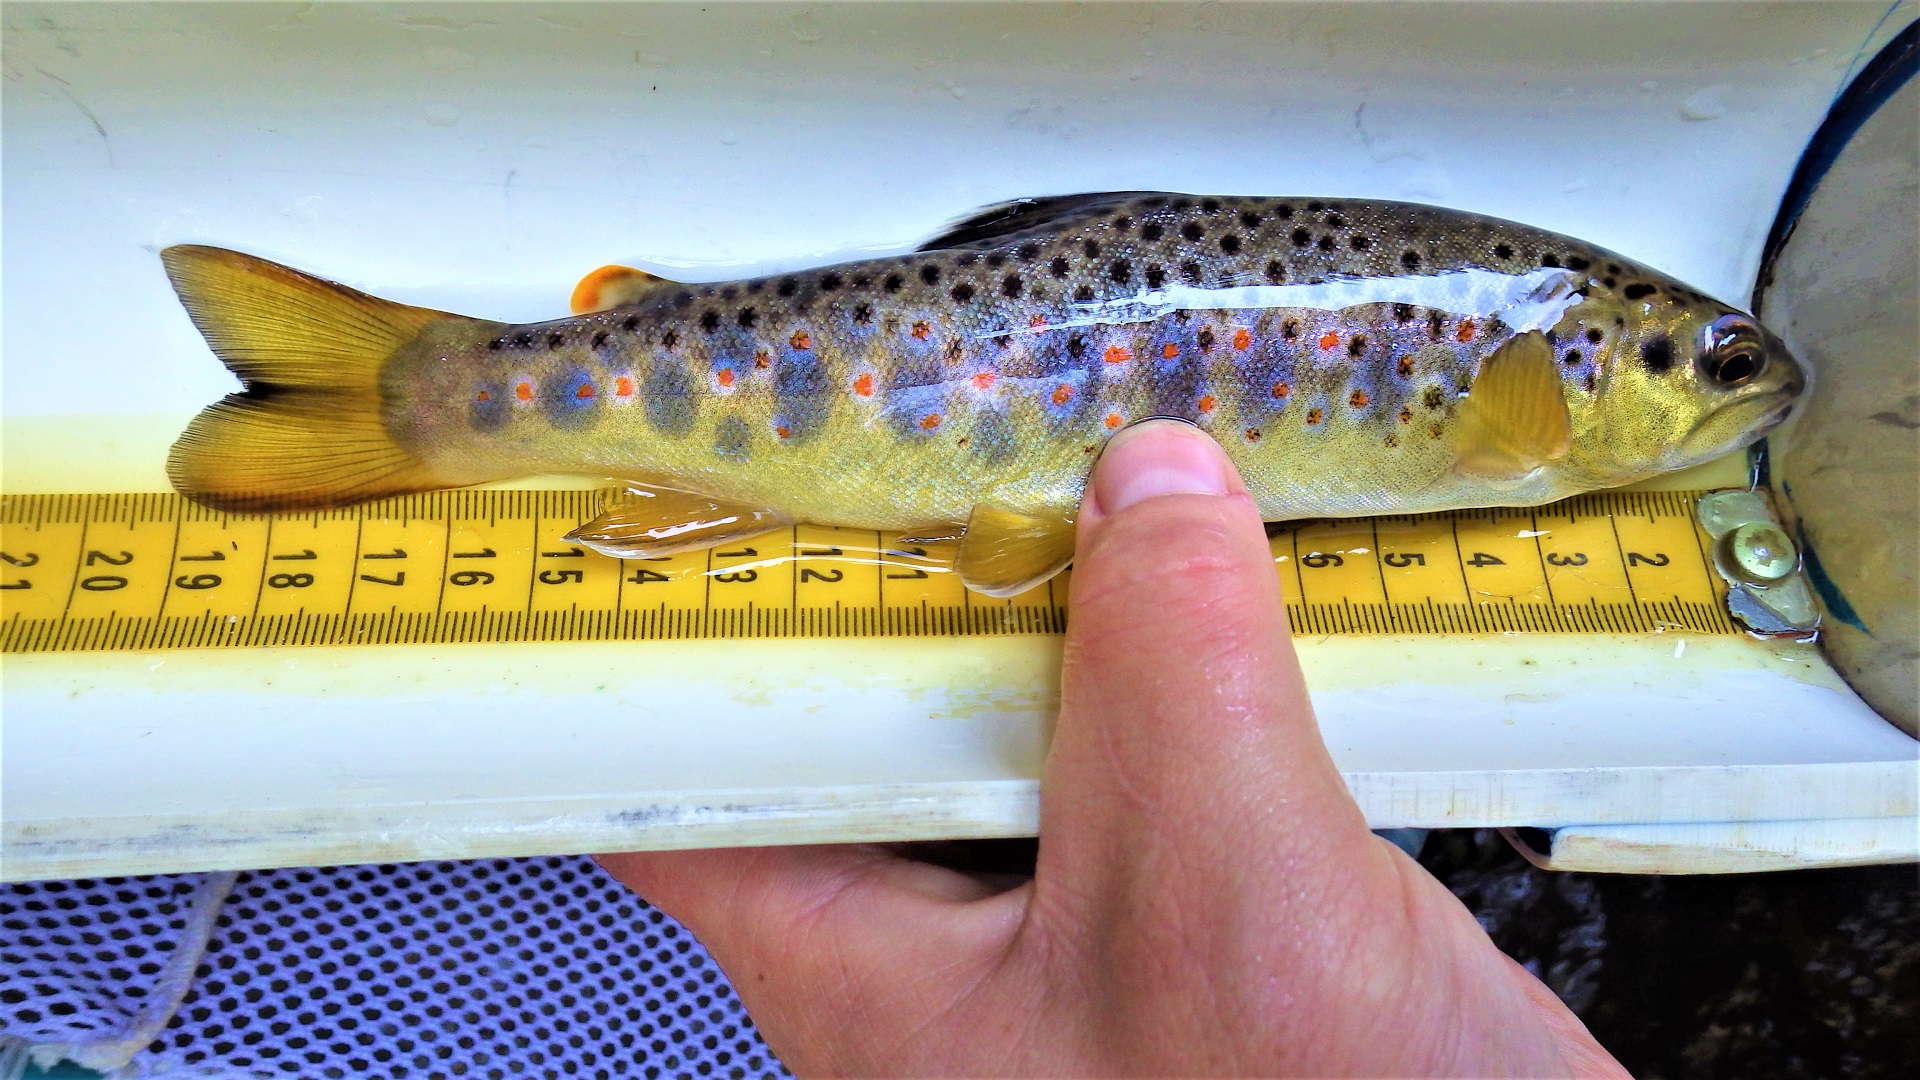
This beautiful brown trout from Skookum Creek is an indicator of a healthy stream, since they require clean water to survive.
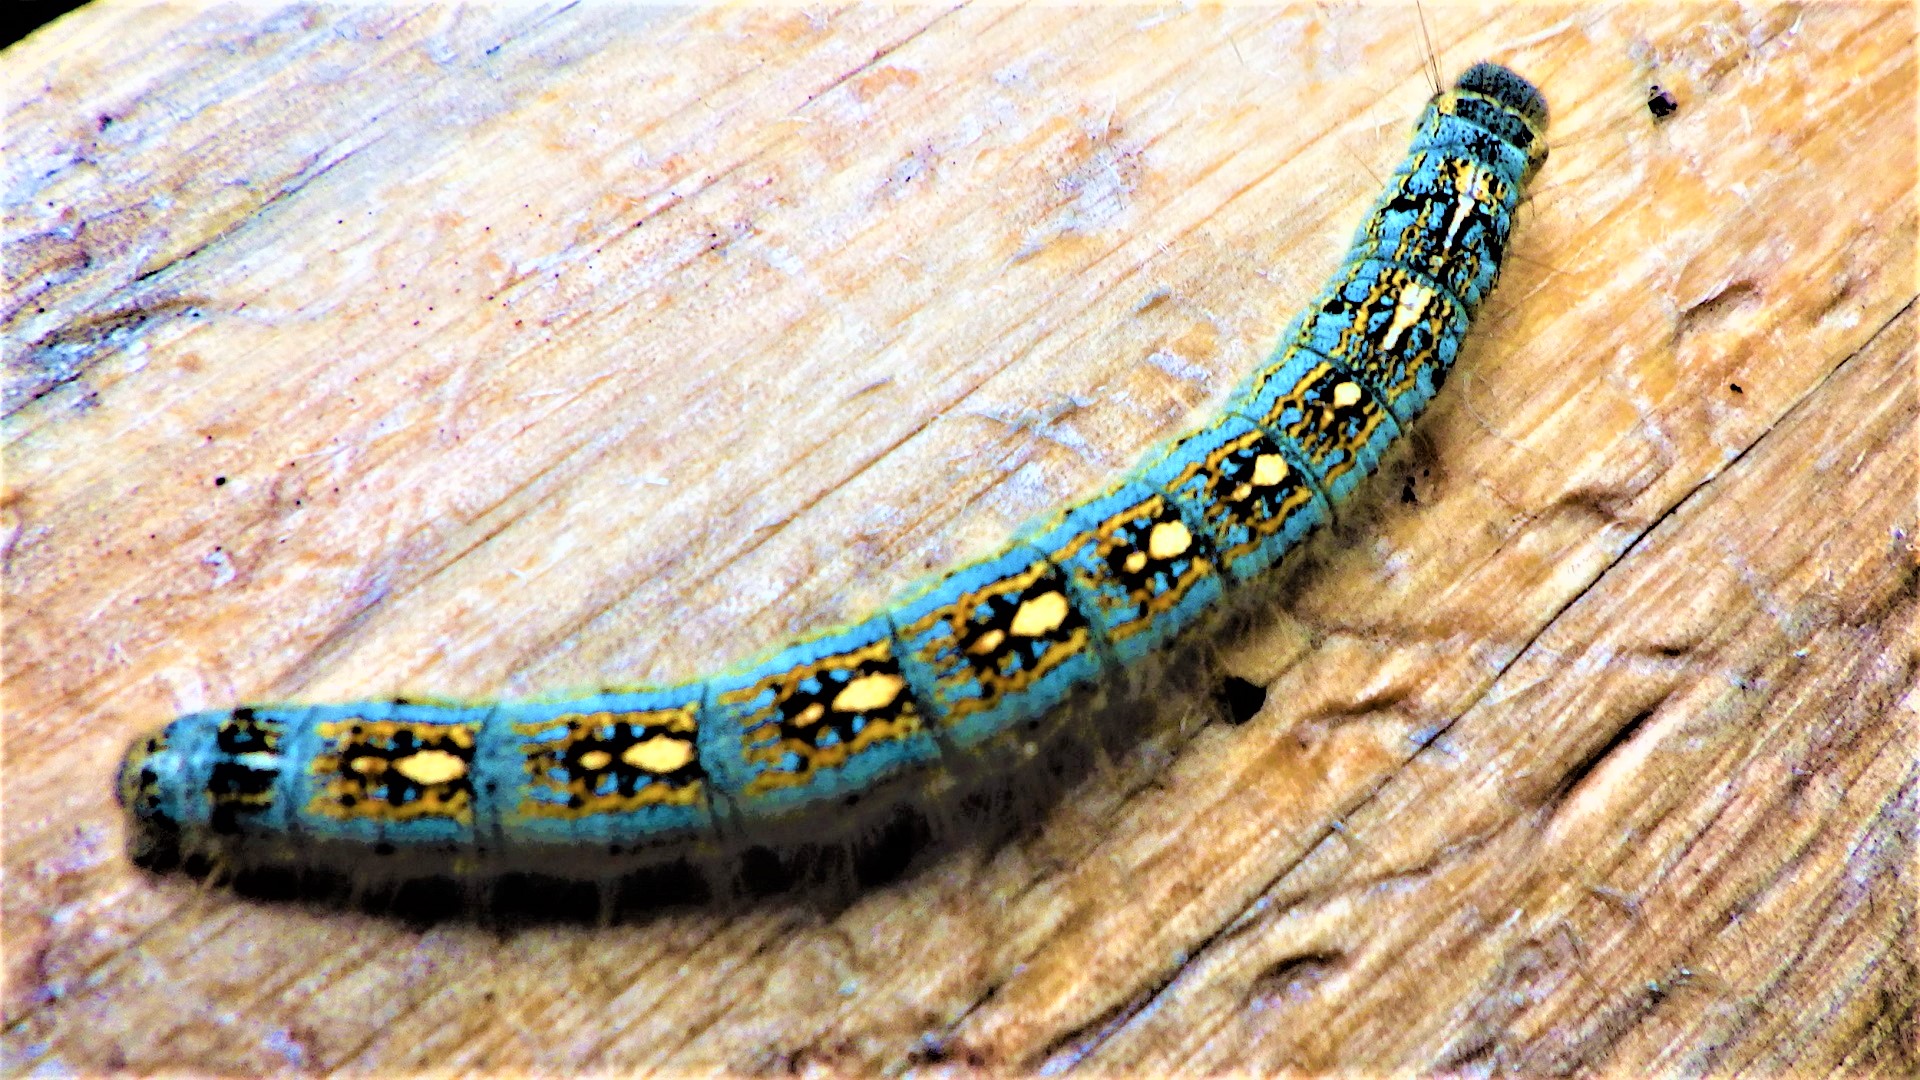
This Forest tent caterpillar on a piece of fallen wood is a pretty sight at Deadman Creek.
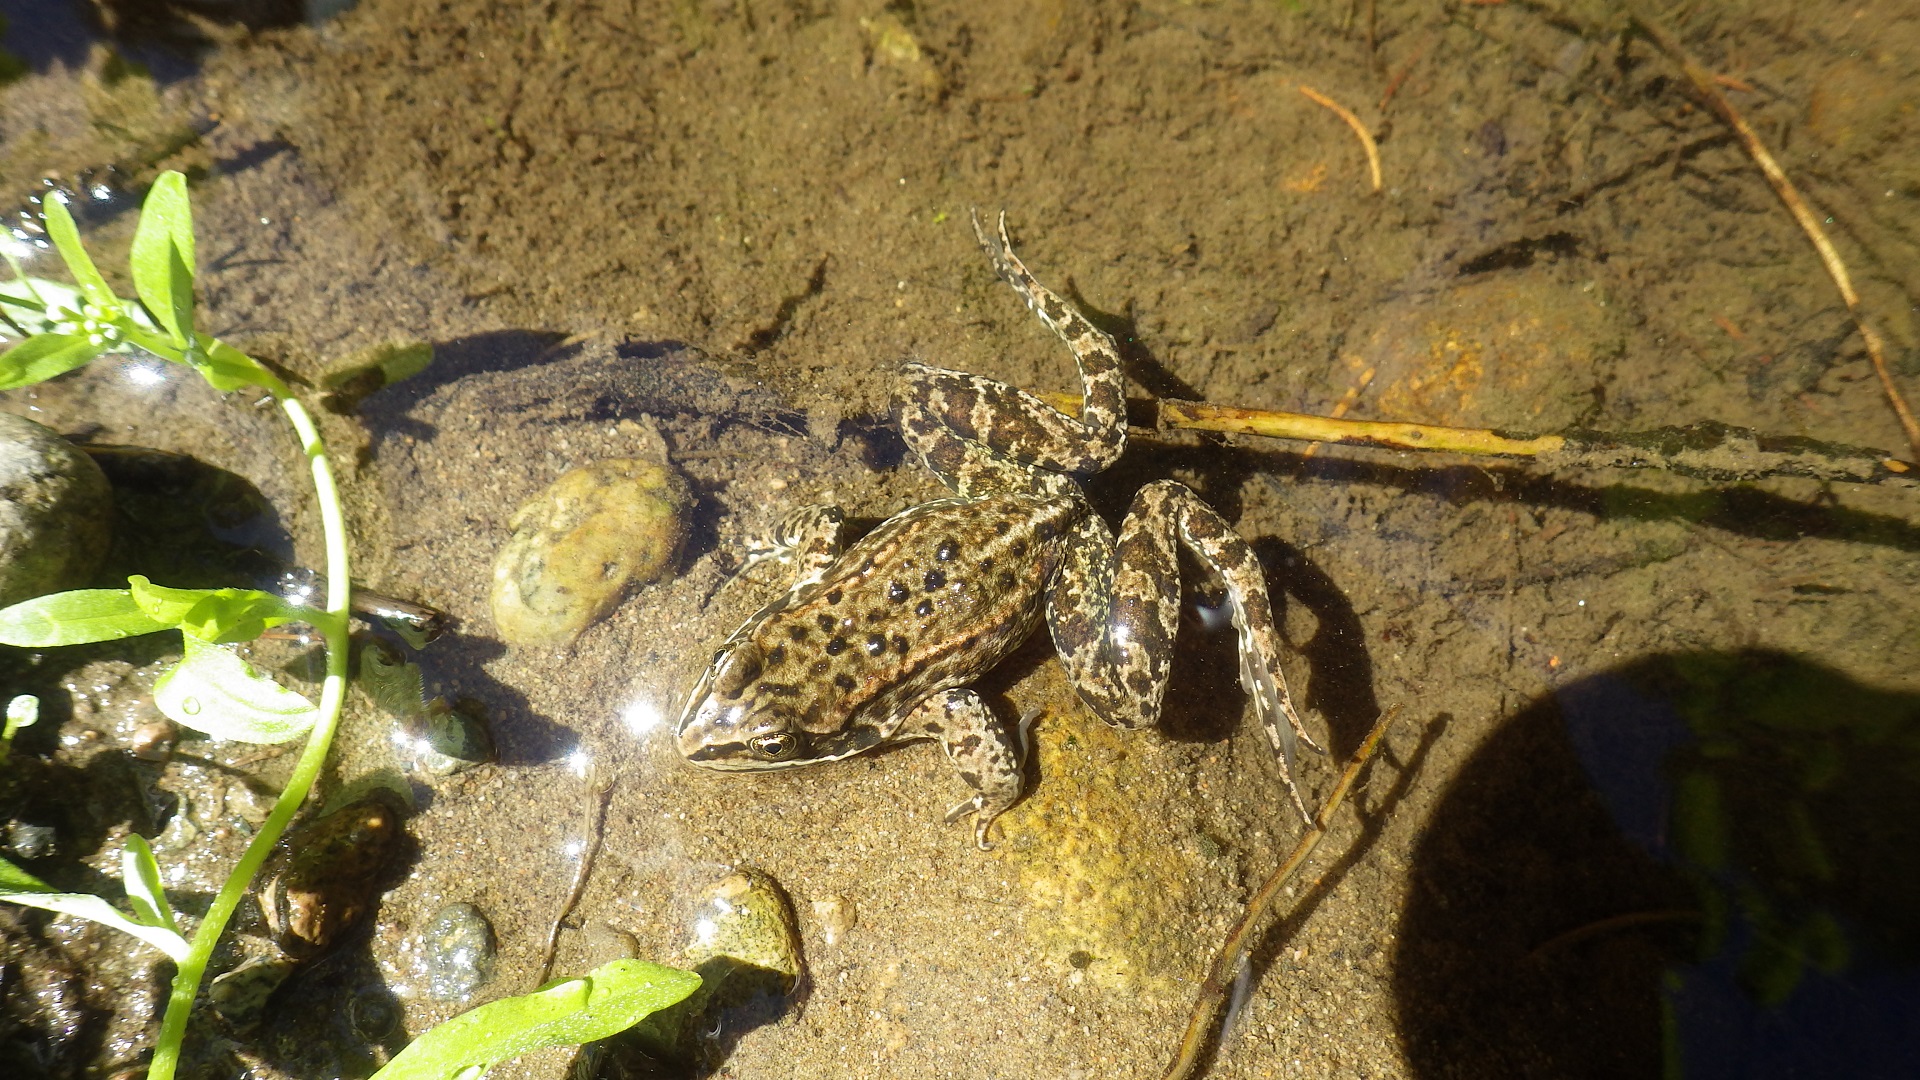
This Columbia Spotted frog from a tributary of Big Sheep Creek is an indicator species; they are sensitive to pollution.
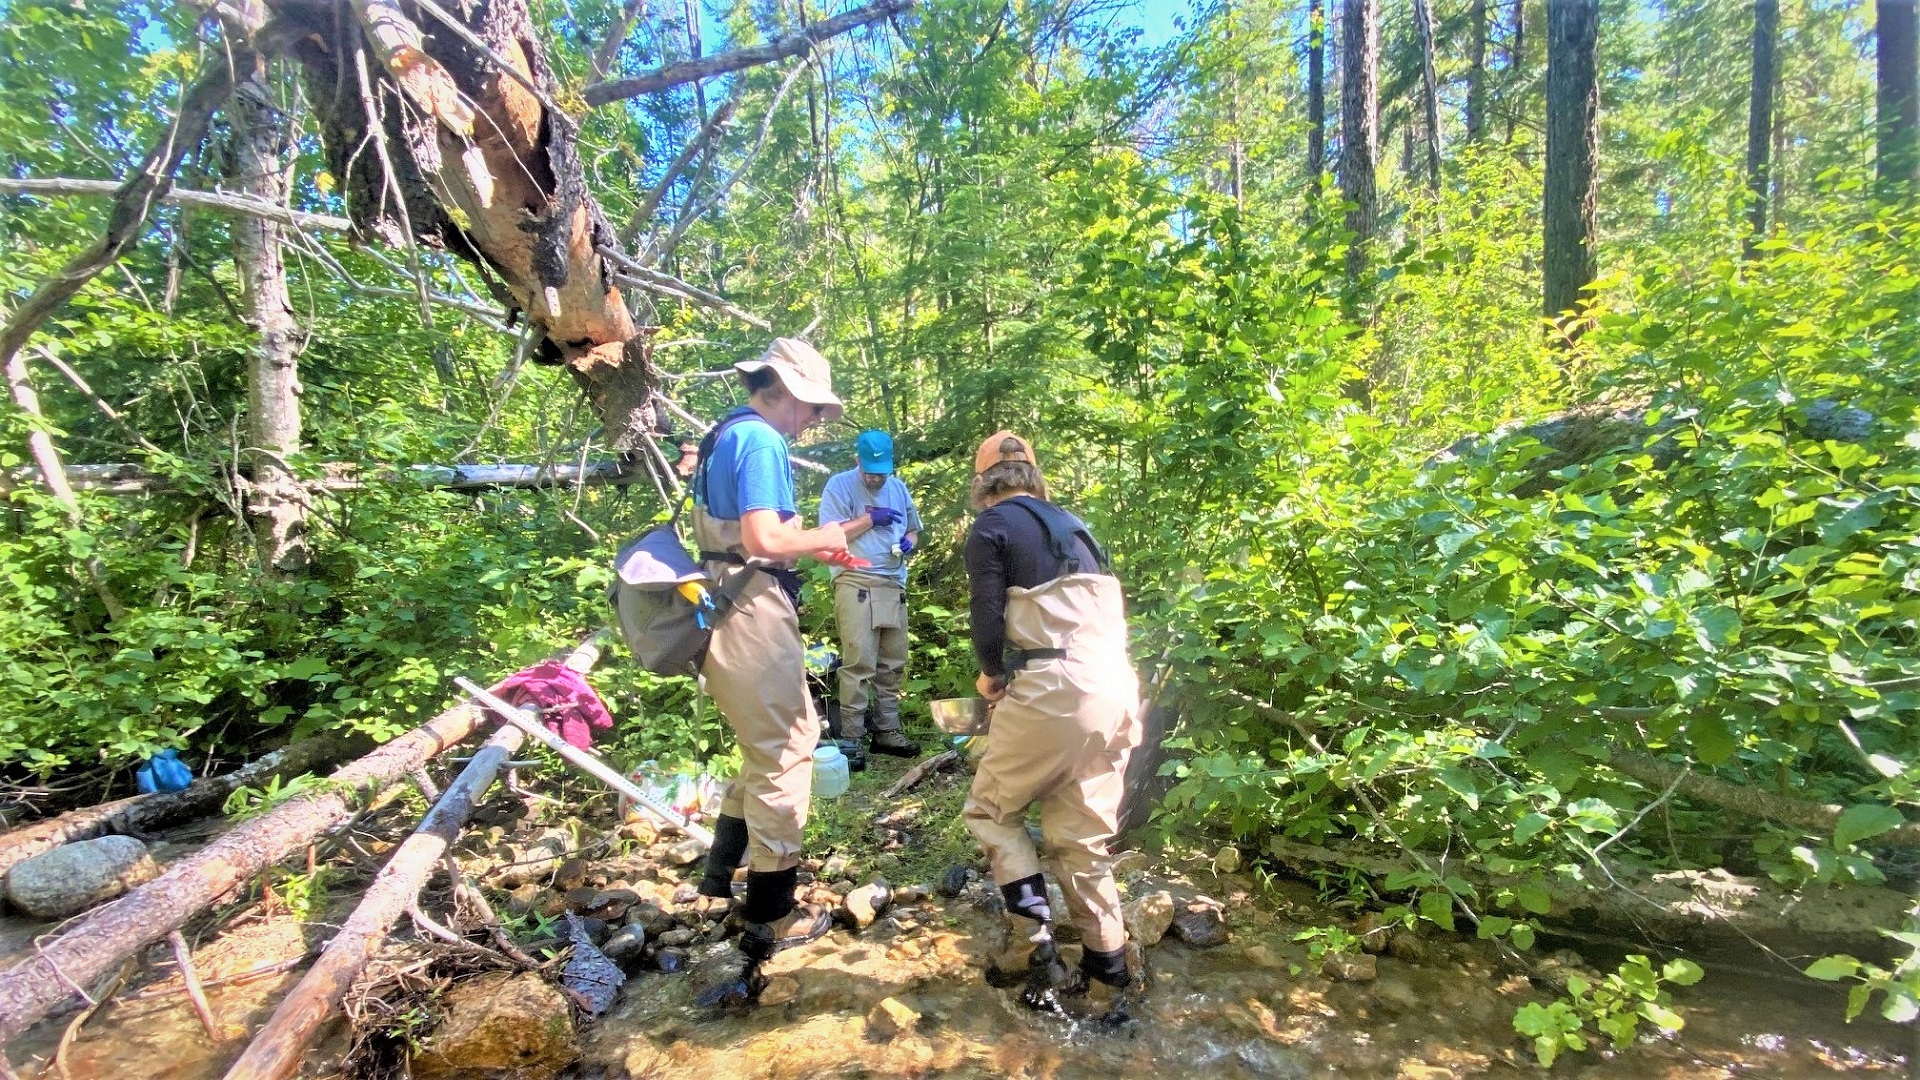
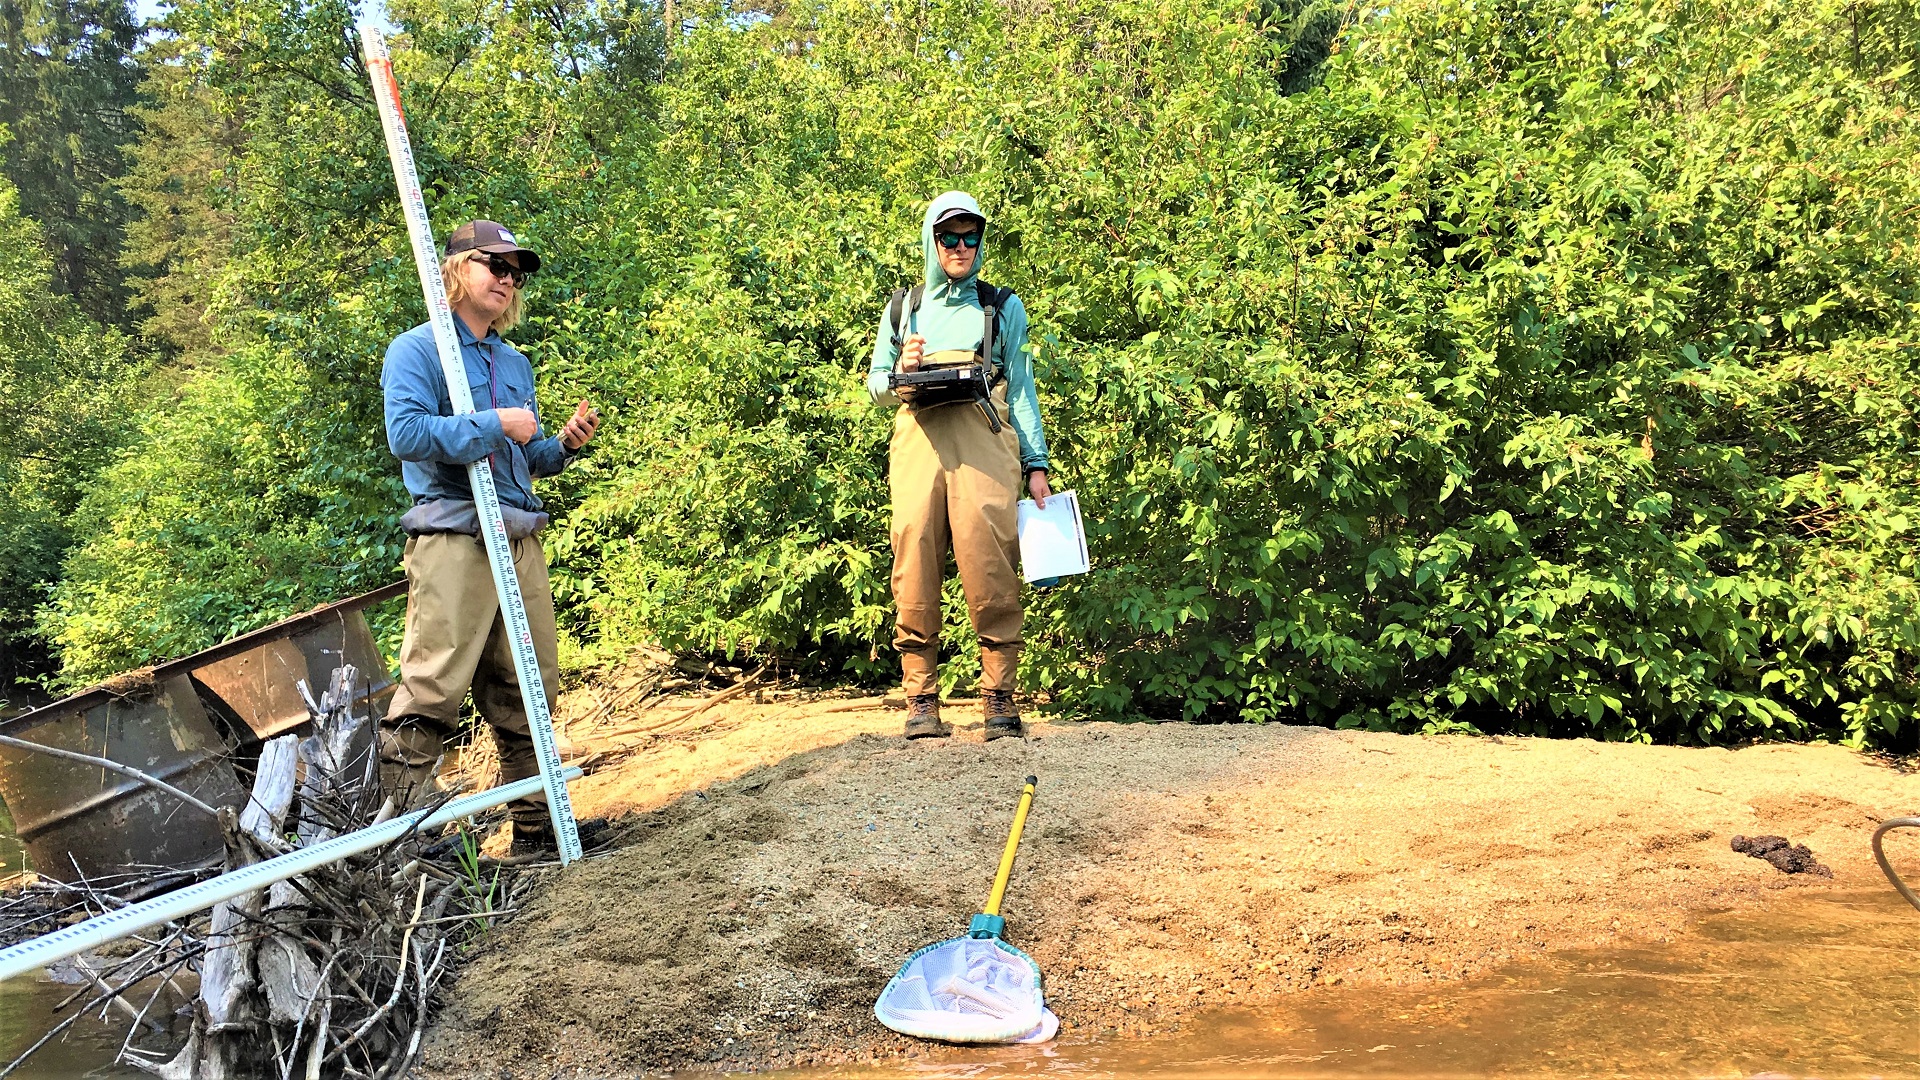
Crewmembers get ready for a full day of sampling: filtering water for periphyton collection; collecting gravel, sand, and clay for sediment chemistry; and collecting water quality samples.
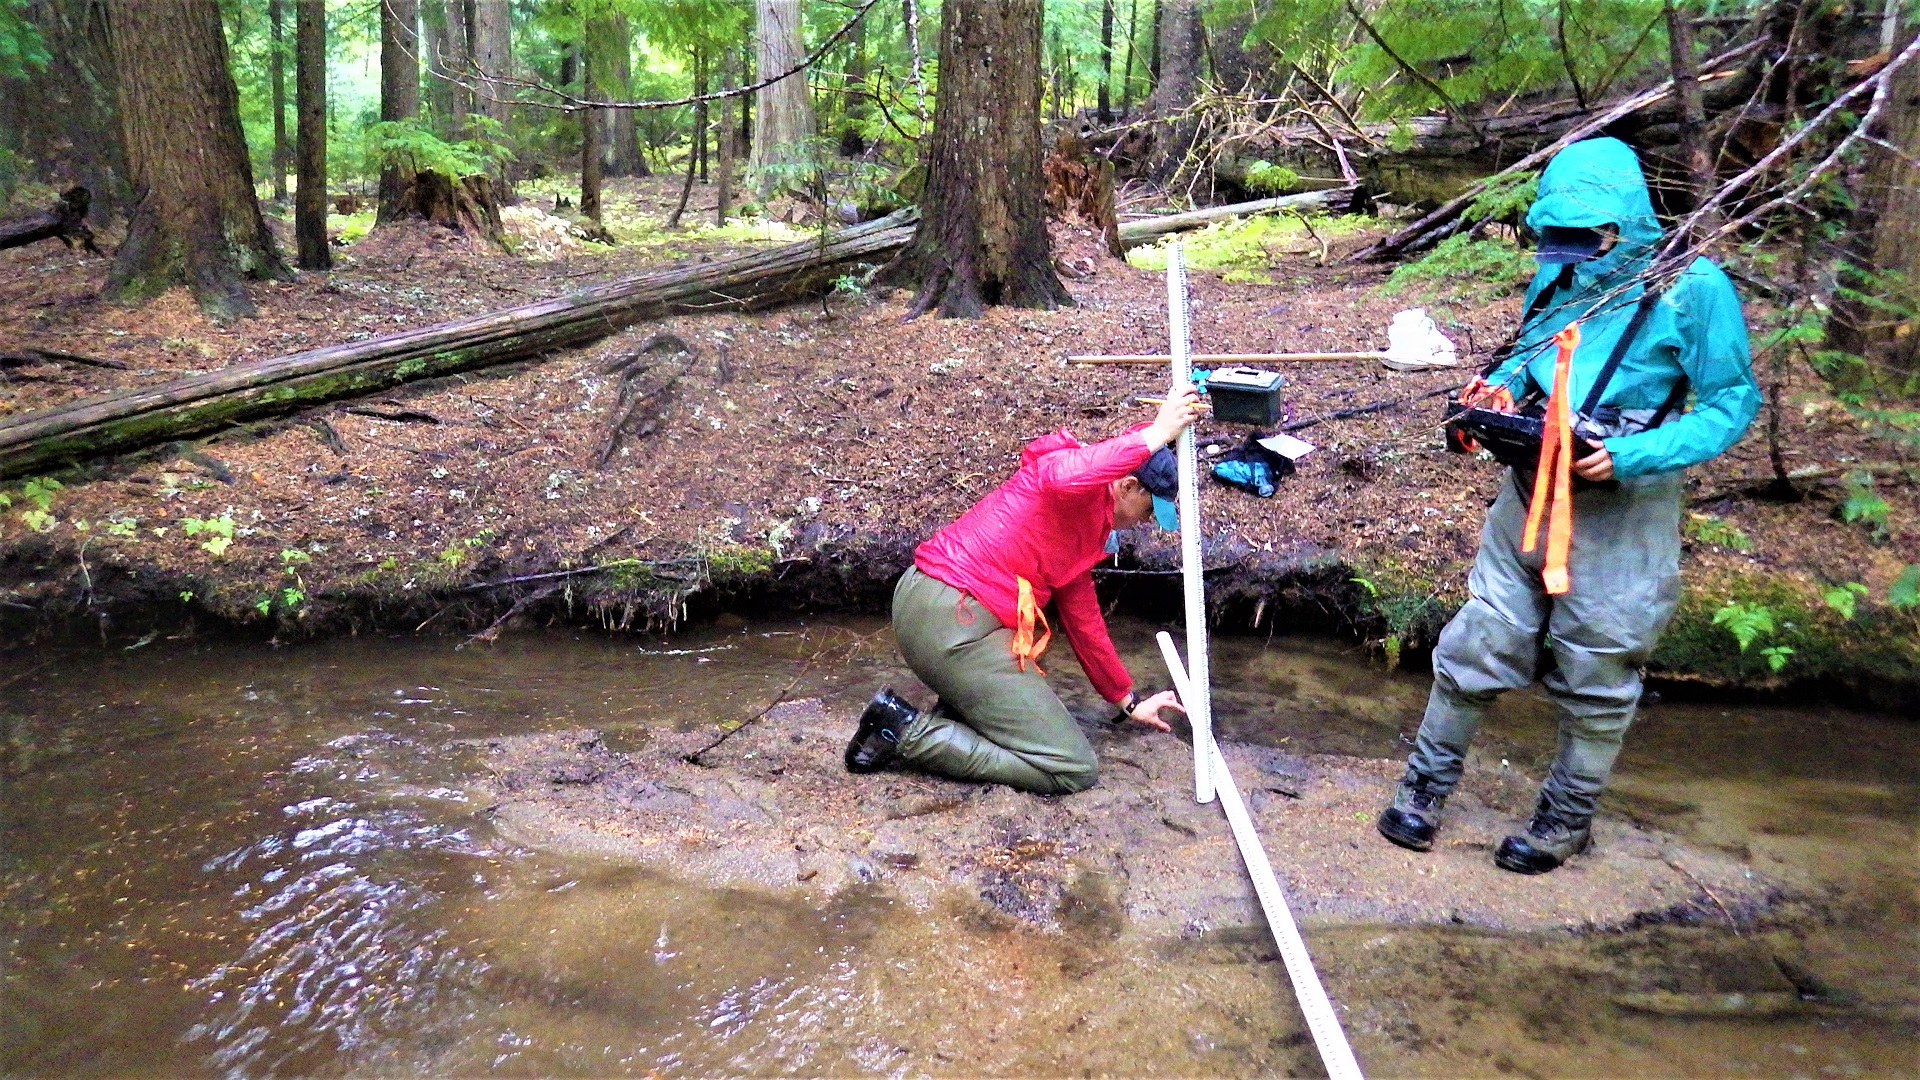
Crewmembers measure wetted and bankfull depths across this stream bar at the North Fork of Goose Creek.
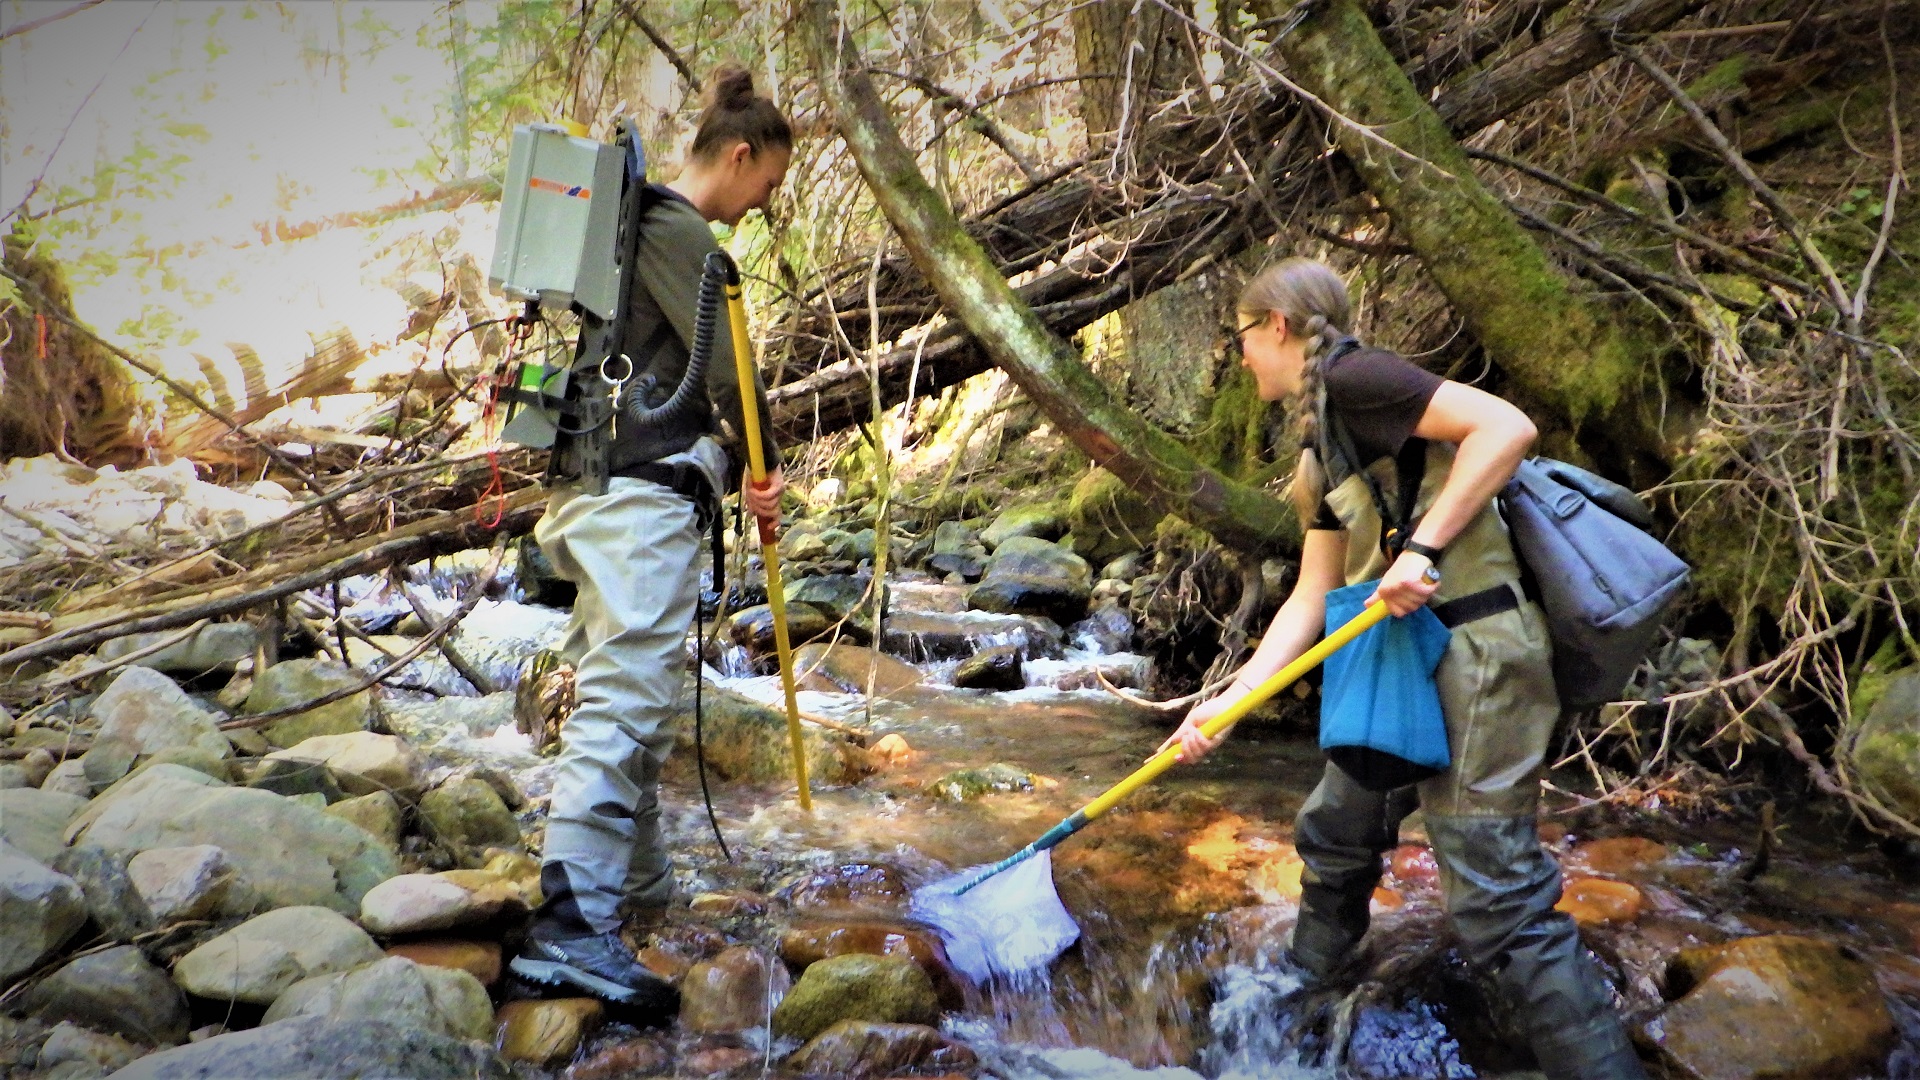
We examine fish assemblages at Sullivan Creek by backpack electrofishing in the stream.
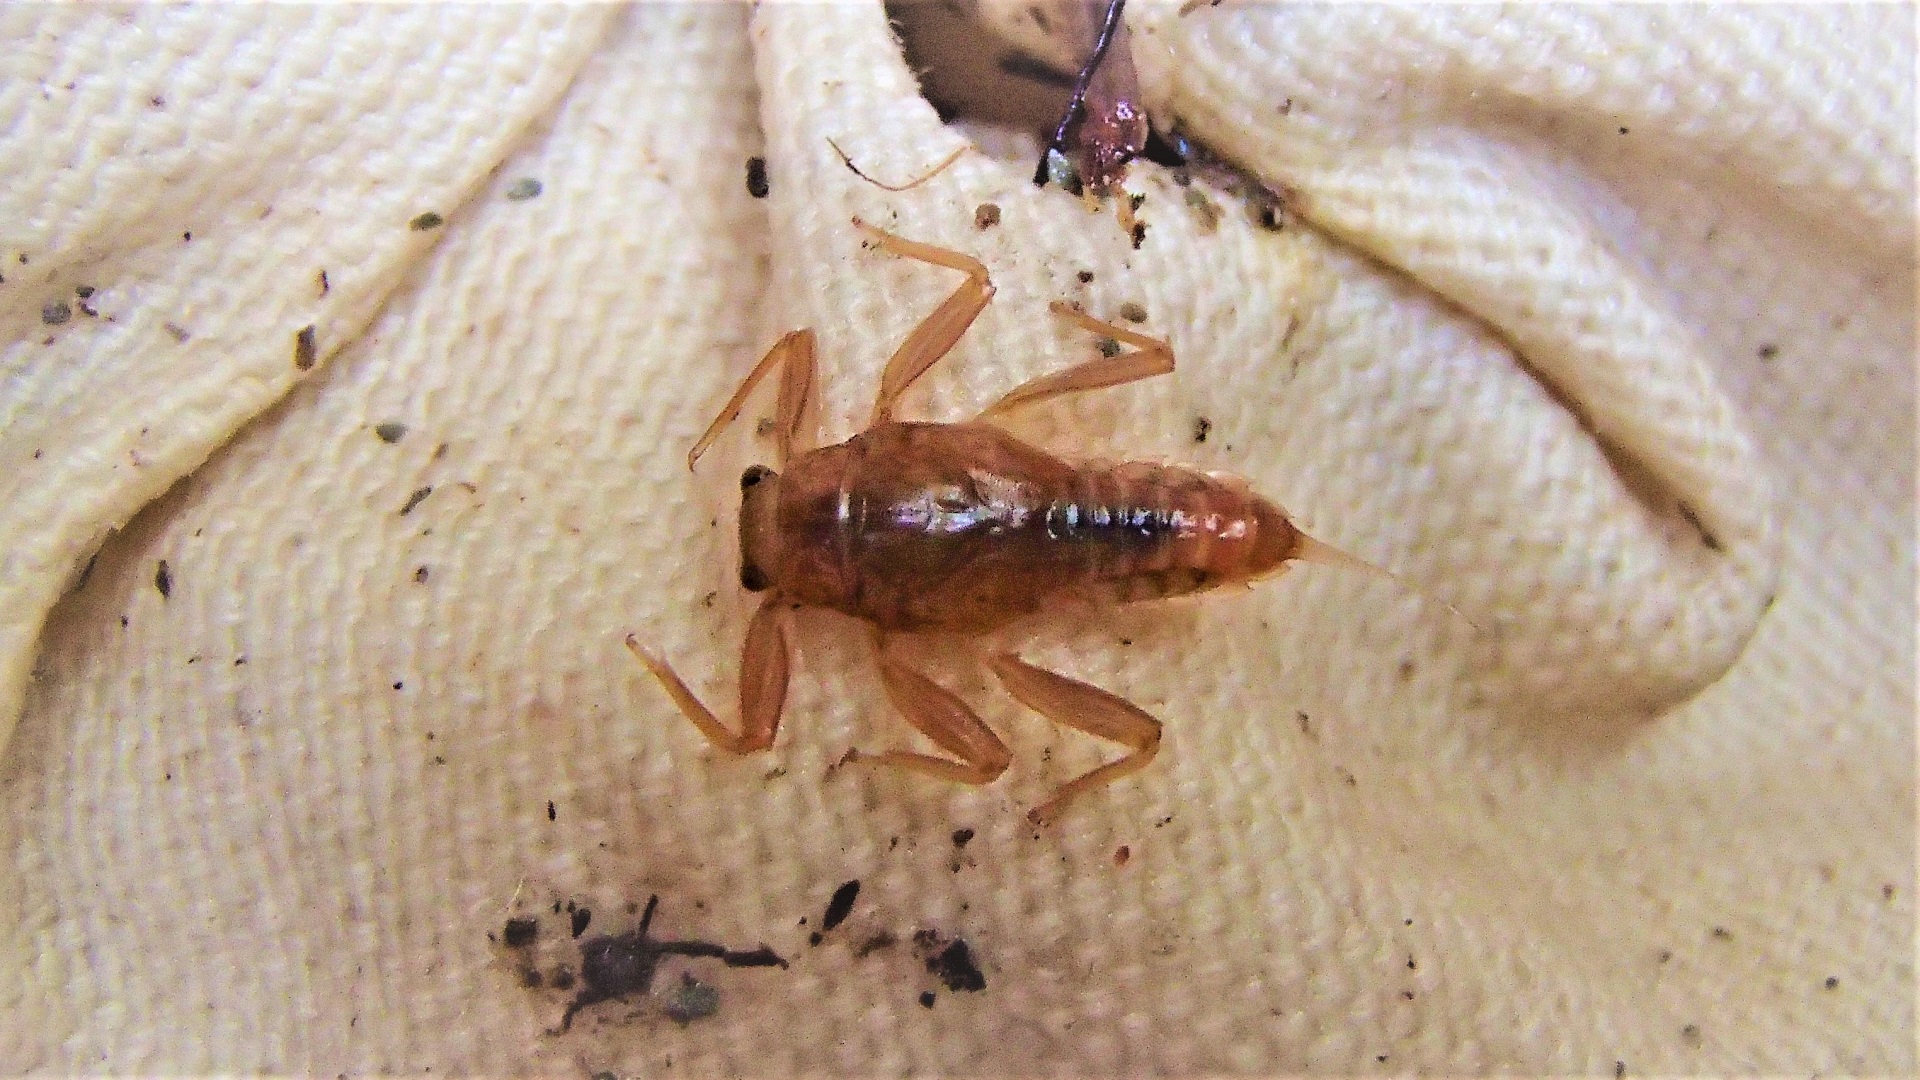
This mayfly from the Little Pend Oreille River suggests a healthy stream.
Crewmembers record human influence at Le Clerc Creek, such as this drum on the bank of the creek.
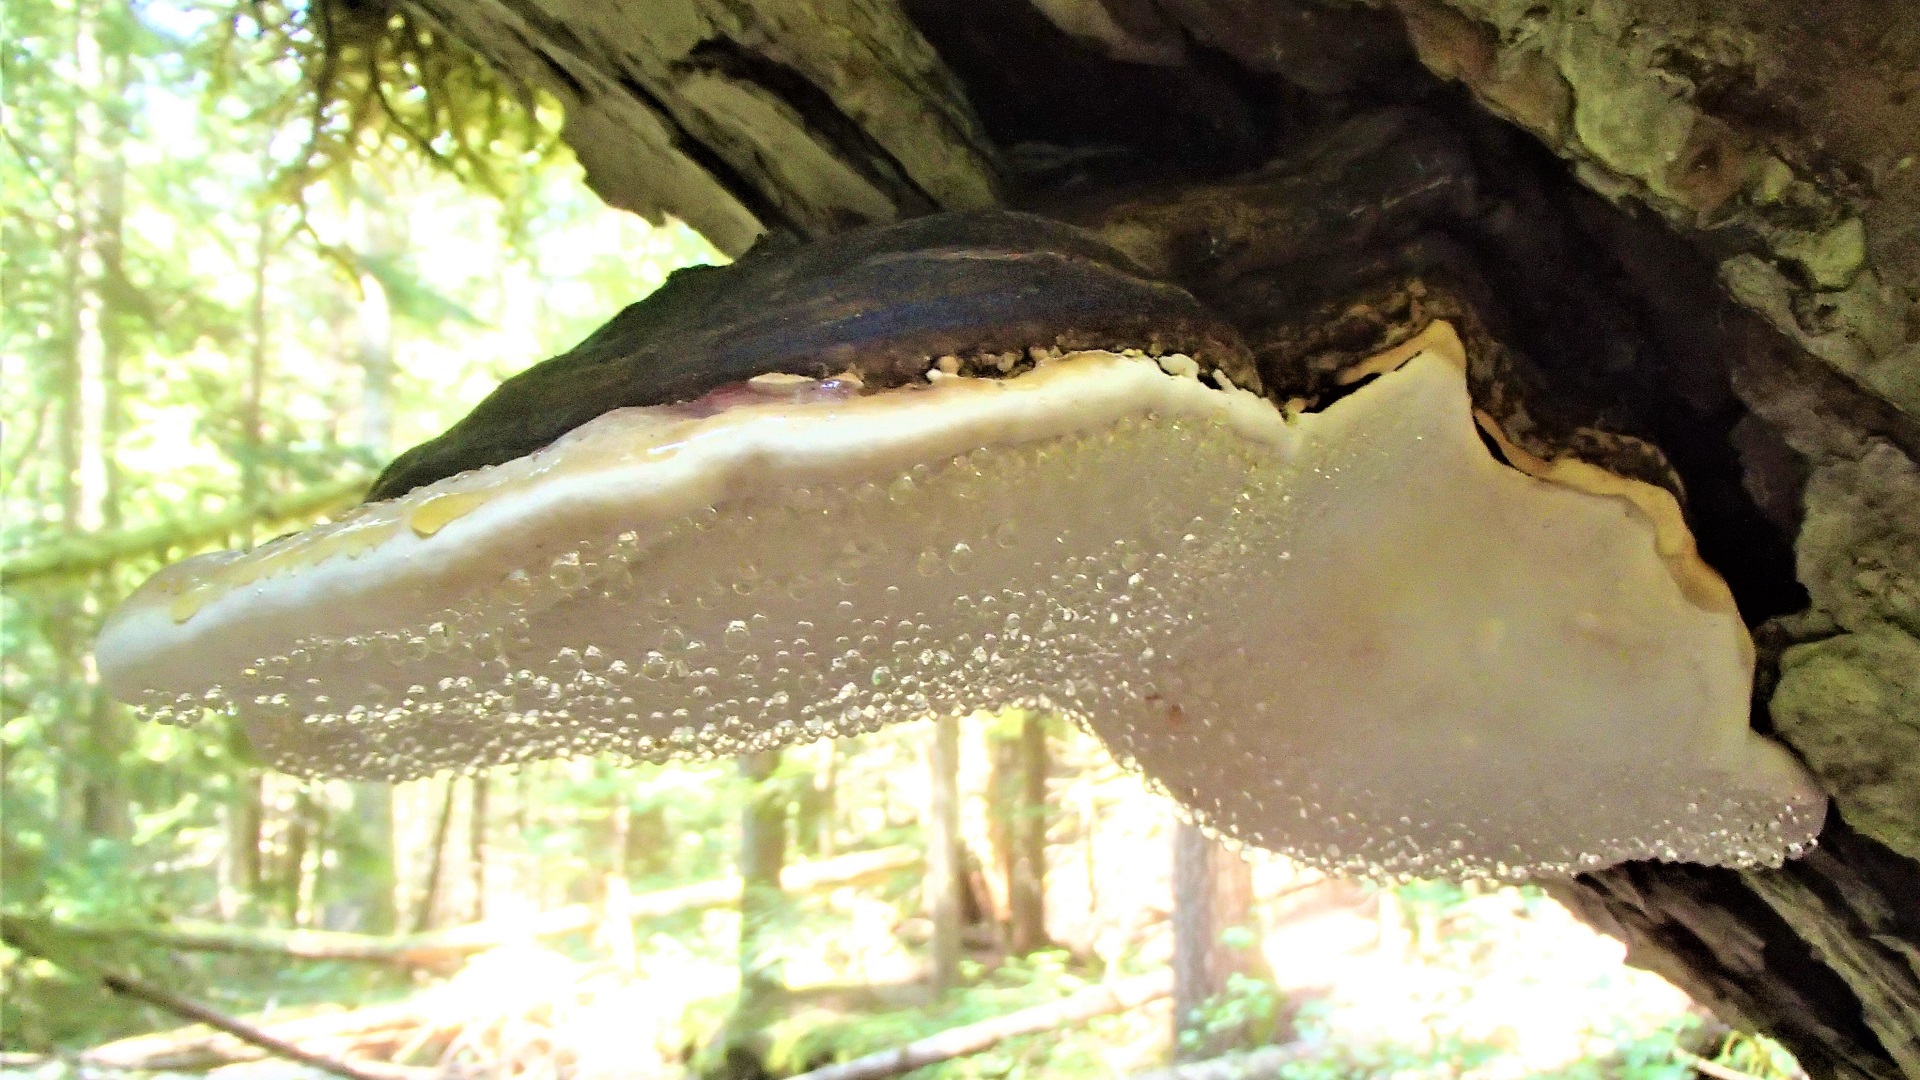
This conch fungus is growing on decaying large woody debris and will eventually fall into the stream and become part of the healthy stream below.
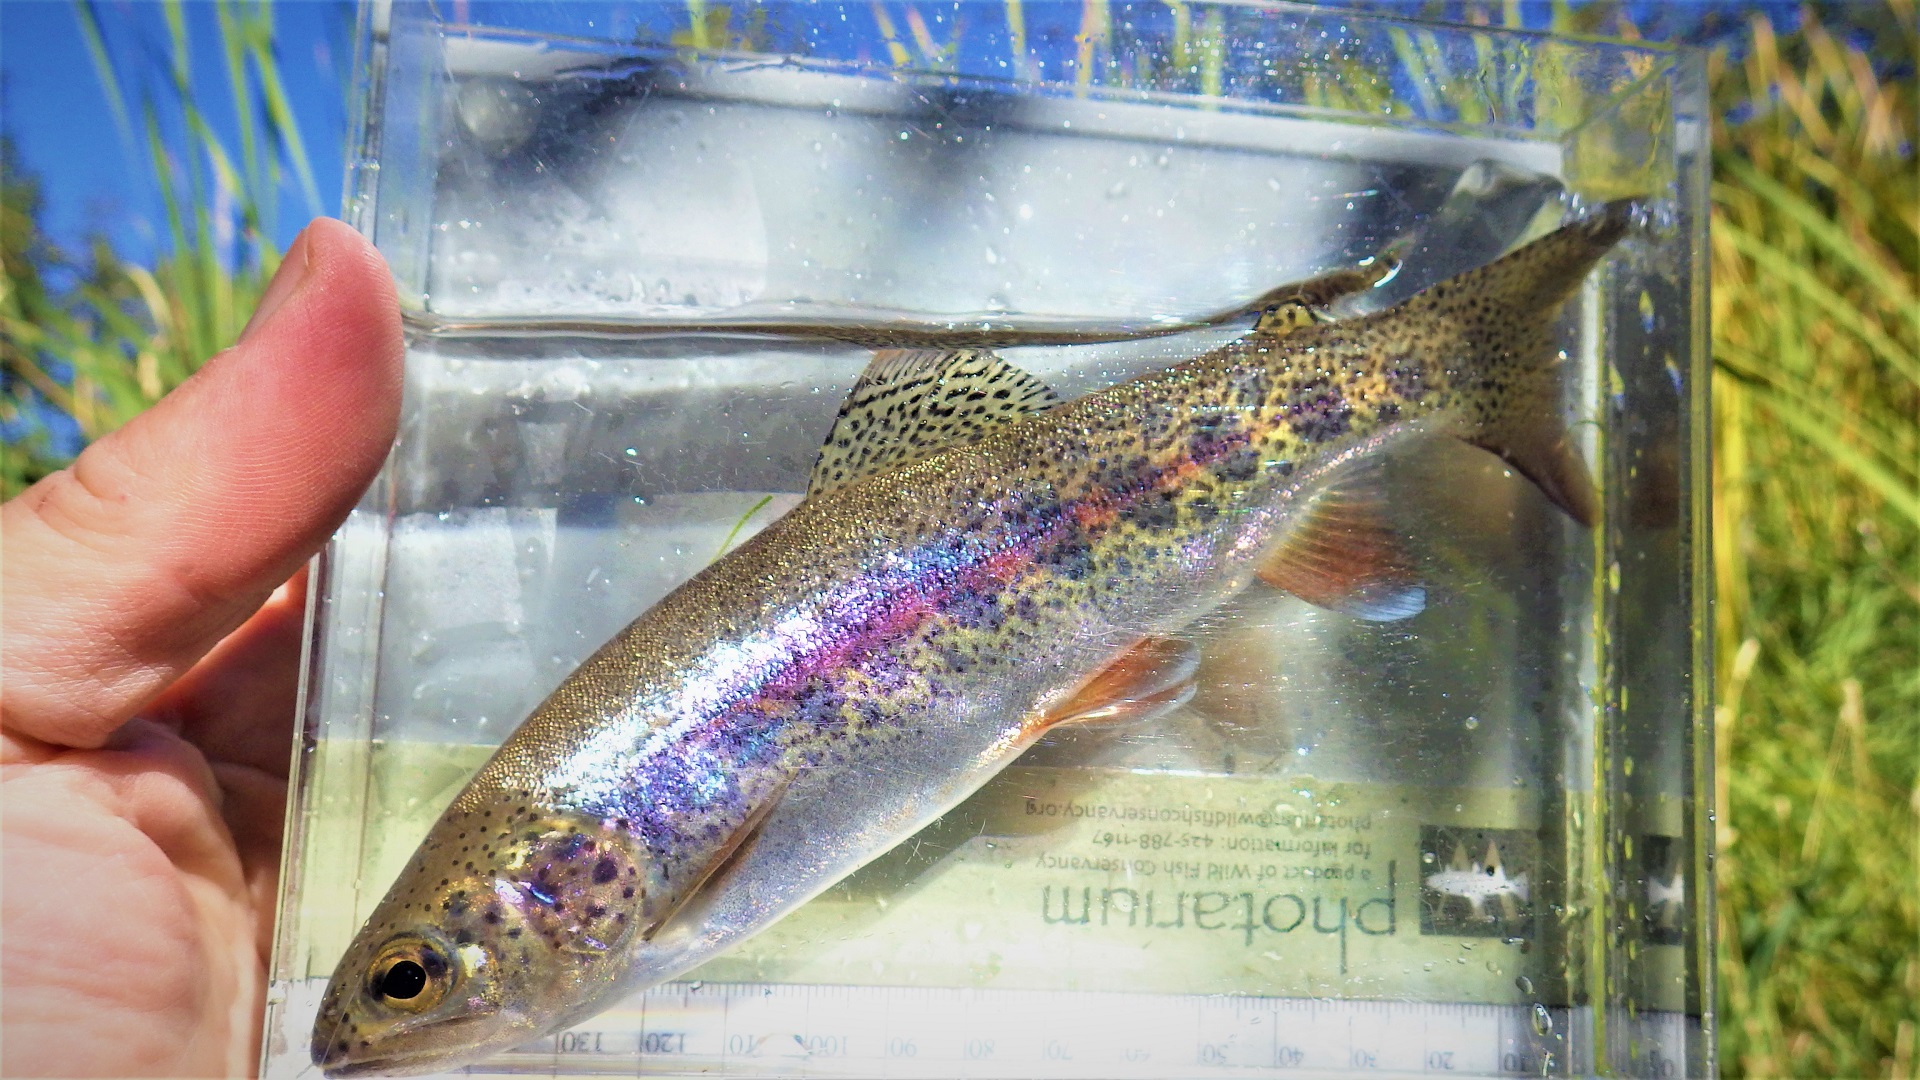
Fishing is a fun way to see which species inhabit the creek. Our catch indicates the health of a stream. Rainbow trout like cold clean water.
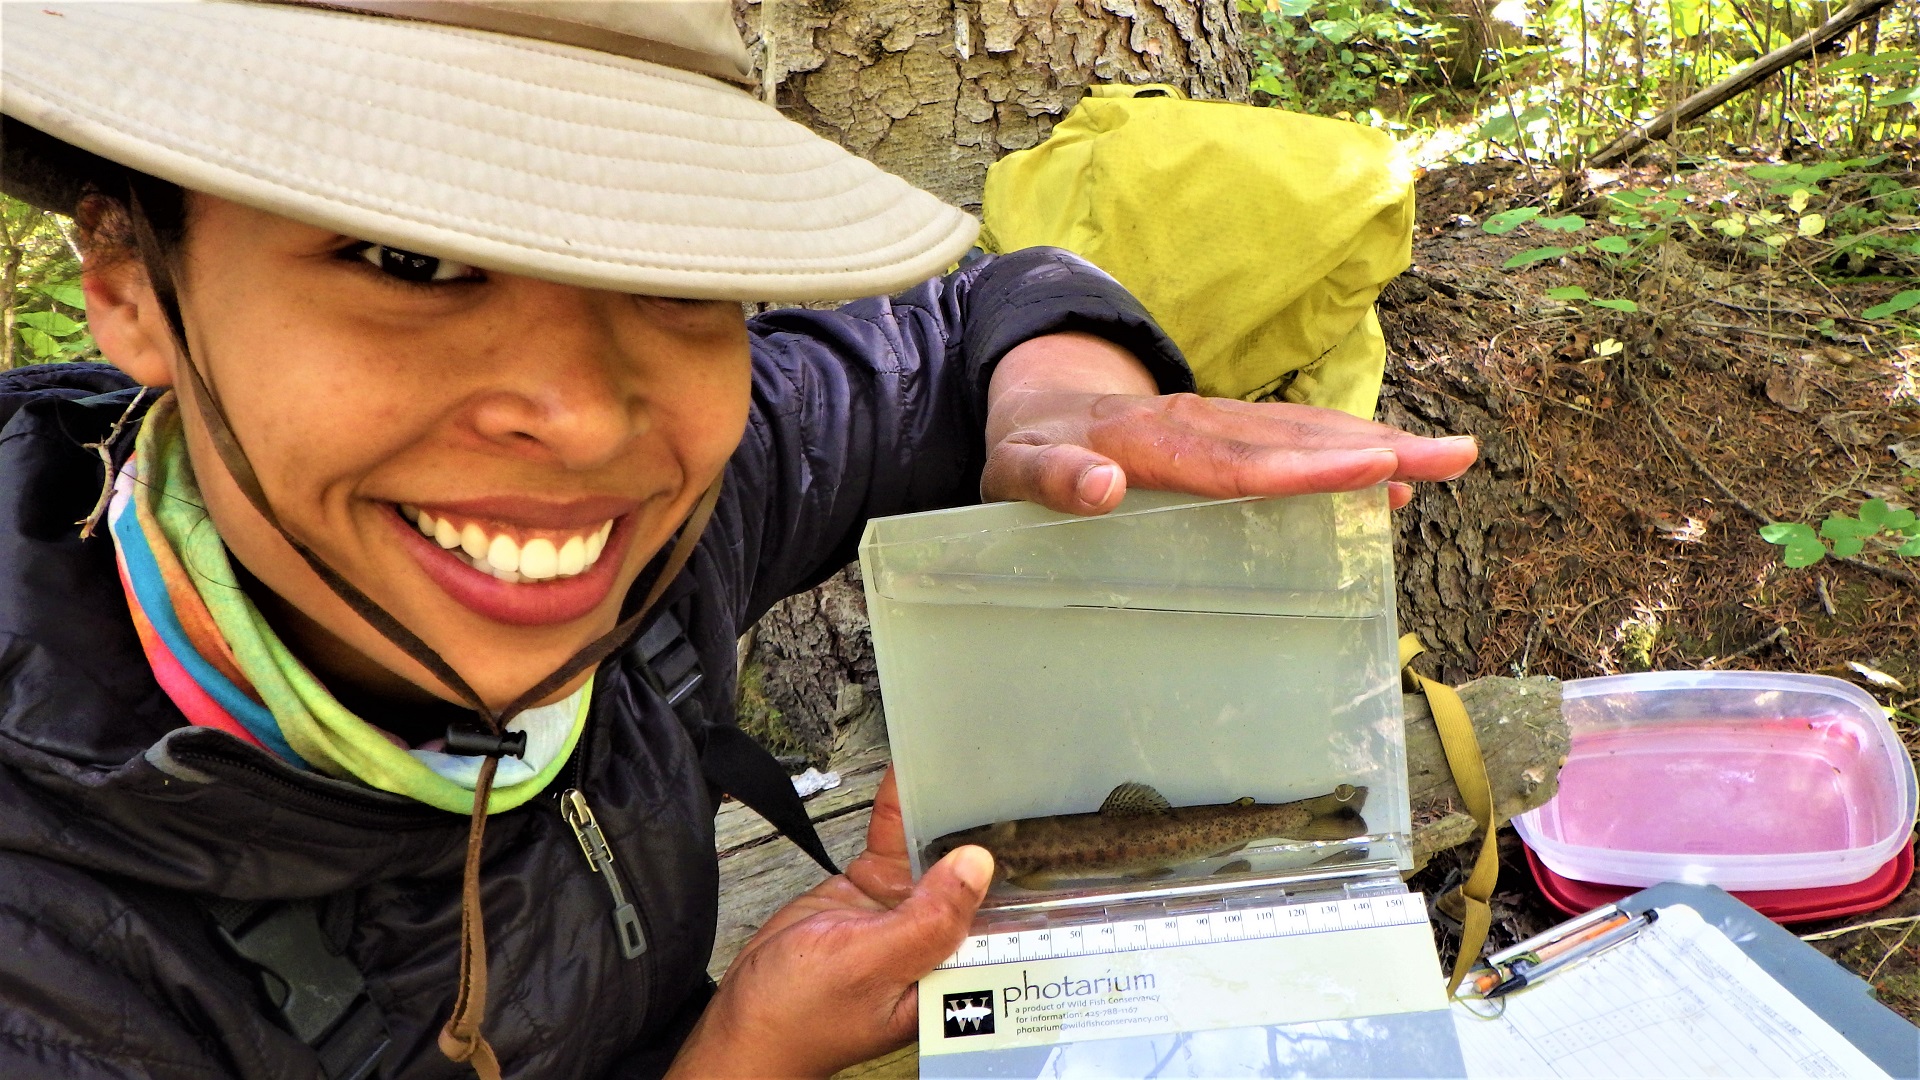
A rainbow trout from Hawk Creek is identified in a photarium.
Crewmembers record qualitative and quantitative data at over 50 streams each summer.
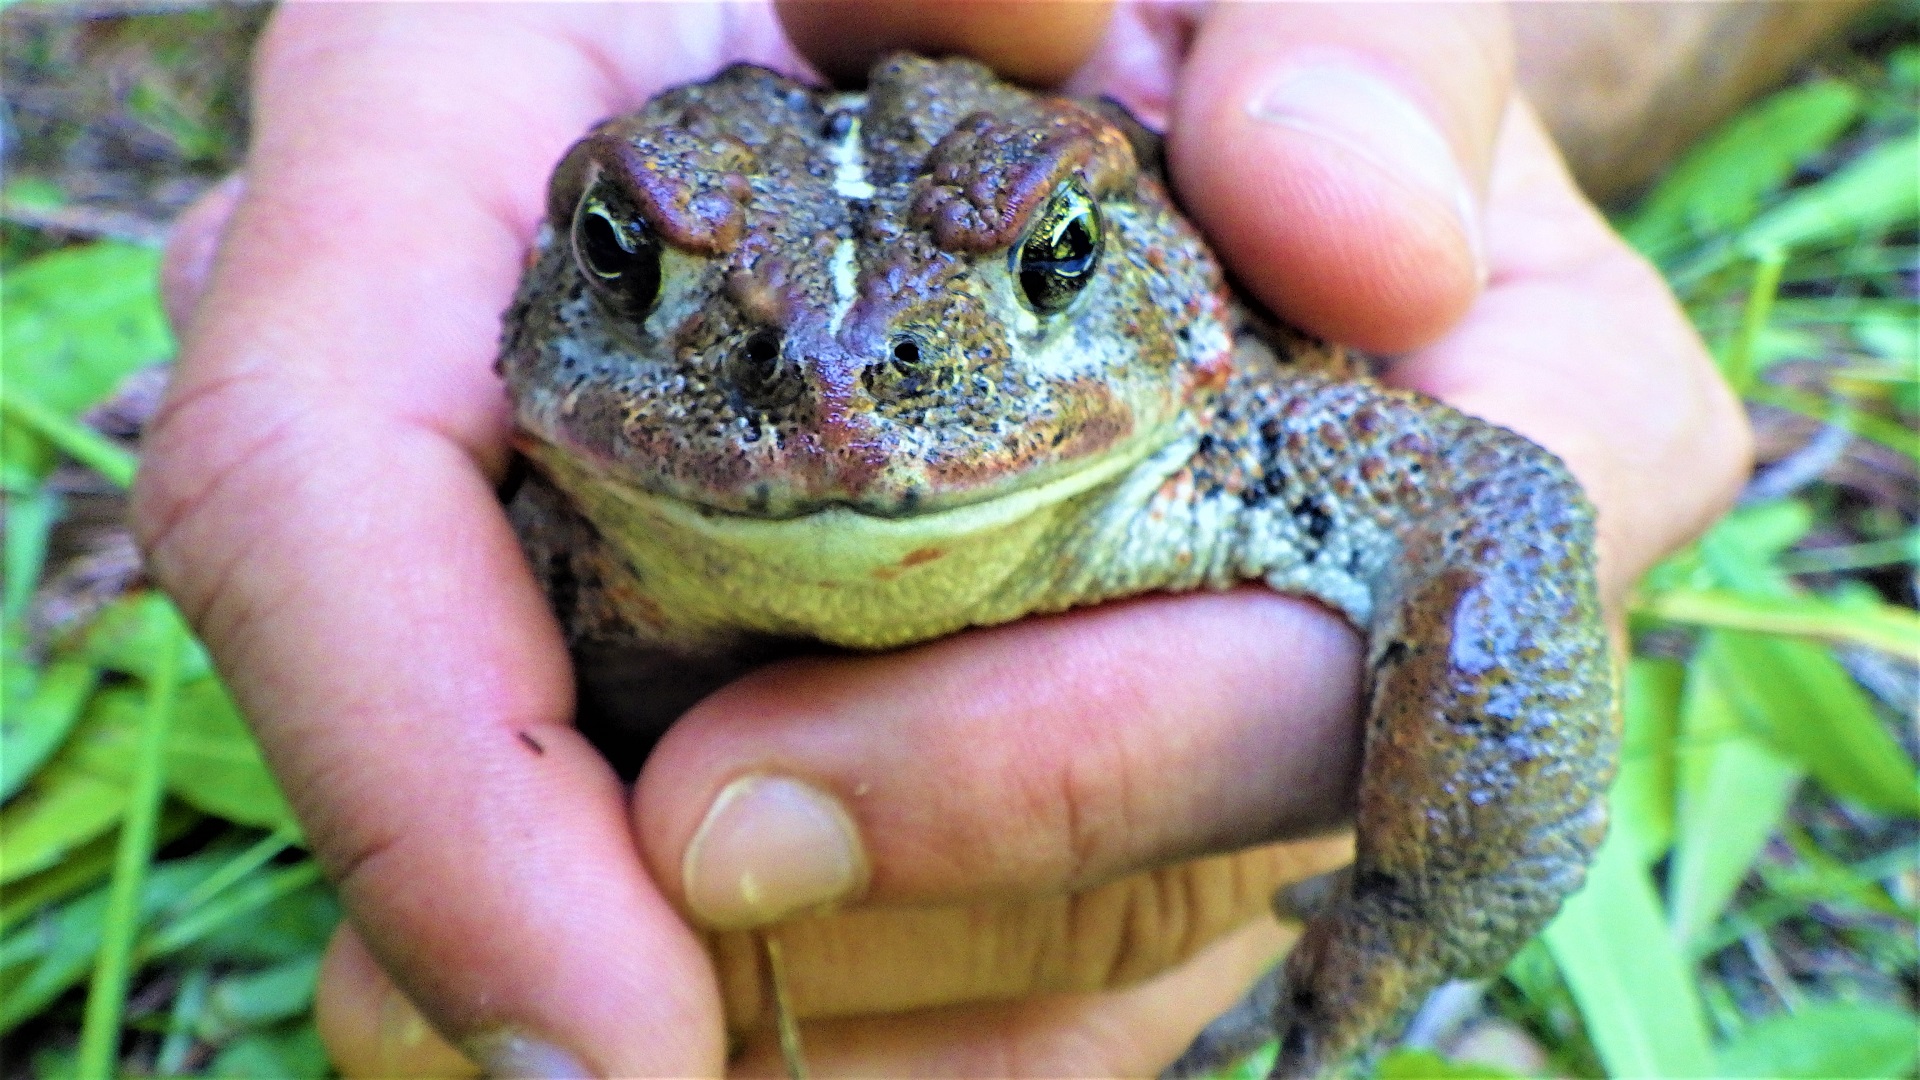
This Western toad was found in a small tributary of Slough Creek.
Because wood in streams provides fish cover and nutrients to macroinvertebrates, crewmembers count large woody debris and brush at a tributary to Onion Creek.