

Watershed health — Snake River update
We investigated the health of stream habitats in the Snake River Status and Trends Region in 2011 and 2016. From these two study years, the region showed a similar biological condition, with the highest stressors involving stream chemistry and human influence.
Use the map to navigate our reports by Status and Trends Region.
Regional summary
- B-IBI scores in the Snake River Region show the proportion of stream kilometers classified as being in good biological condition slightly decreased from 2011 to 2016.
- The most prevalent stressors for streams in the Snake River Region were high water temperatures, elevated nutrient concentrations, increased human influence, high pH, and increased substrate embeddedness.
Biological condition
Invertebrate biological condition of streams, as assessed with B-IBI scores, did not change significantly from 2011 to 2016 in the Snake River Region. The proportion of streams classified as good, fair, or poor were not significantly different. However, the percentage of poor B-IBI scores decreased, and the fair and good scores increased slightly.
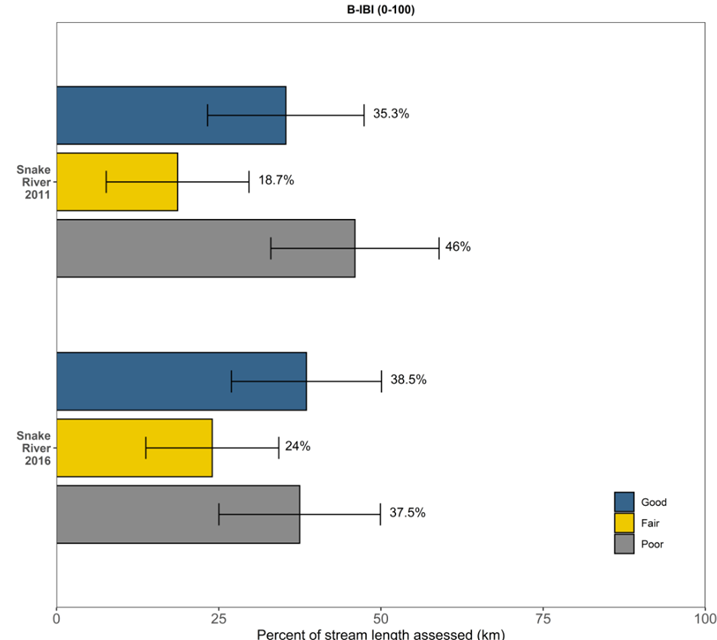
We used B-IBI ratings from 2011 and 2016 to obtain the percentage of stream kilometers in good, fair, and poor conditions for the Snake River Region. Error bars represent 95% confidence intervals.
Significant physical and chemical stressors
In the Snake River Region, the most prevalent physiochemical stressors pertained to water chemistry, including increased nutrients, elevated suspended solids and high pH. Other prevalent stressors in this region were those associated with water temperature, human influence, and stream substrates, namely high embeddedness and elevated sand or fines. Many of these conditions were widespread in the region, with eight stressors being found in 60–90% of stream kilometers assessed.
To interact with this graph and learn more about these physiochemical stressors, hold your mouse over each bar.
This interactive graph shows the percentage of stream kilometers assessed with poor physiochemical conditions in the Snake River Region for 2011 and 2016. The x-axis represents the percentage of river extent in poor condition. Error bars show 95% confidence intervals.
Flip through our field photos!
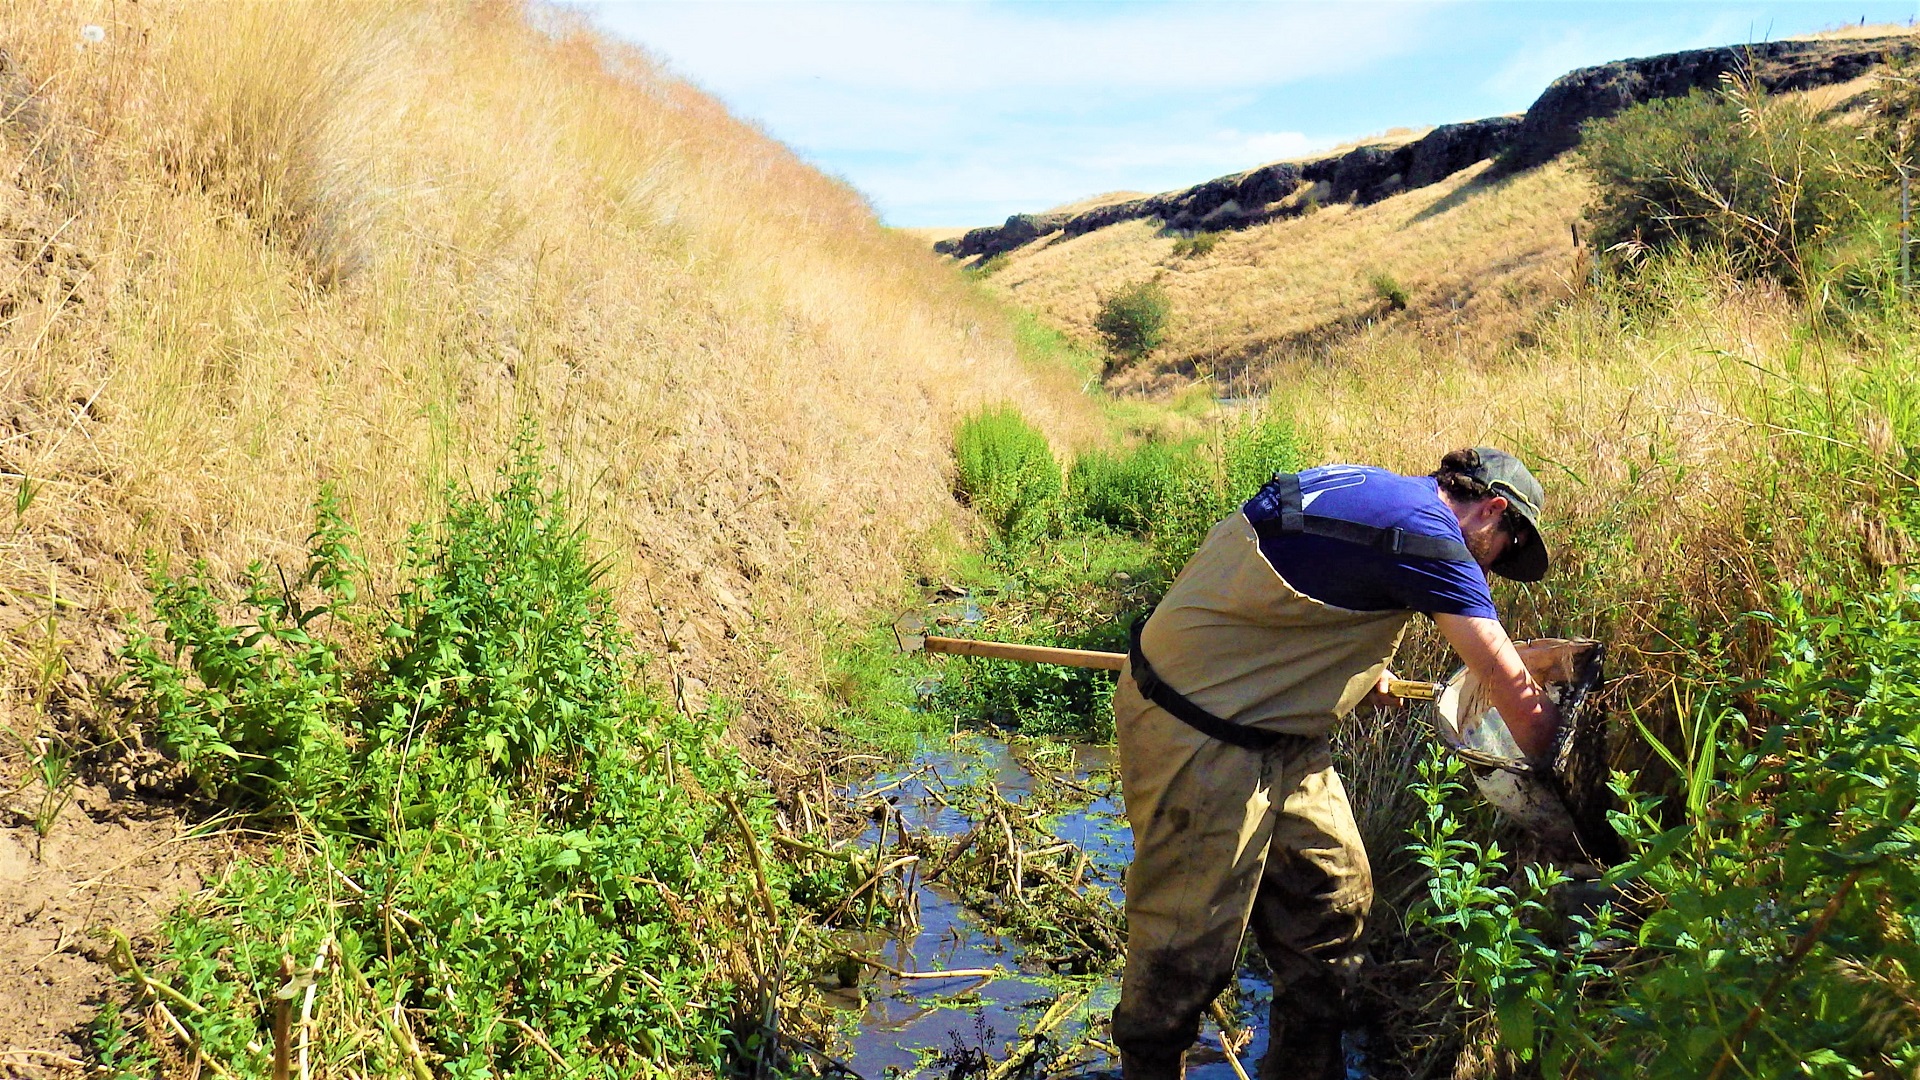
Collecting macroinvertebrates give us an overall understanding of stream health.
The Tucannon River has cool temperatures and rocky substrate that provide healthy habitat for this longnose dace.
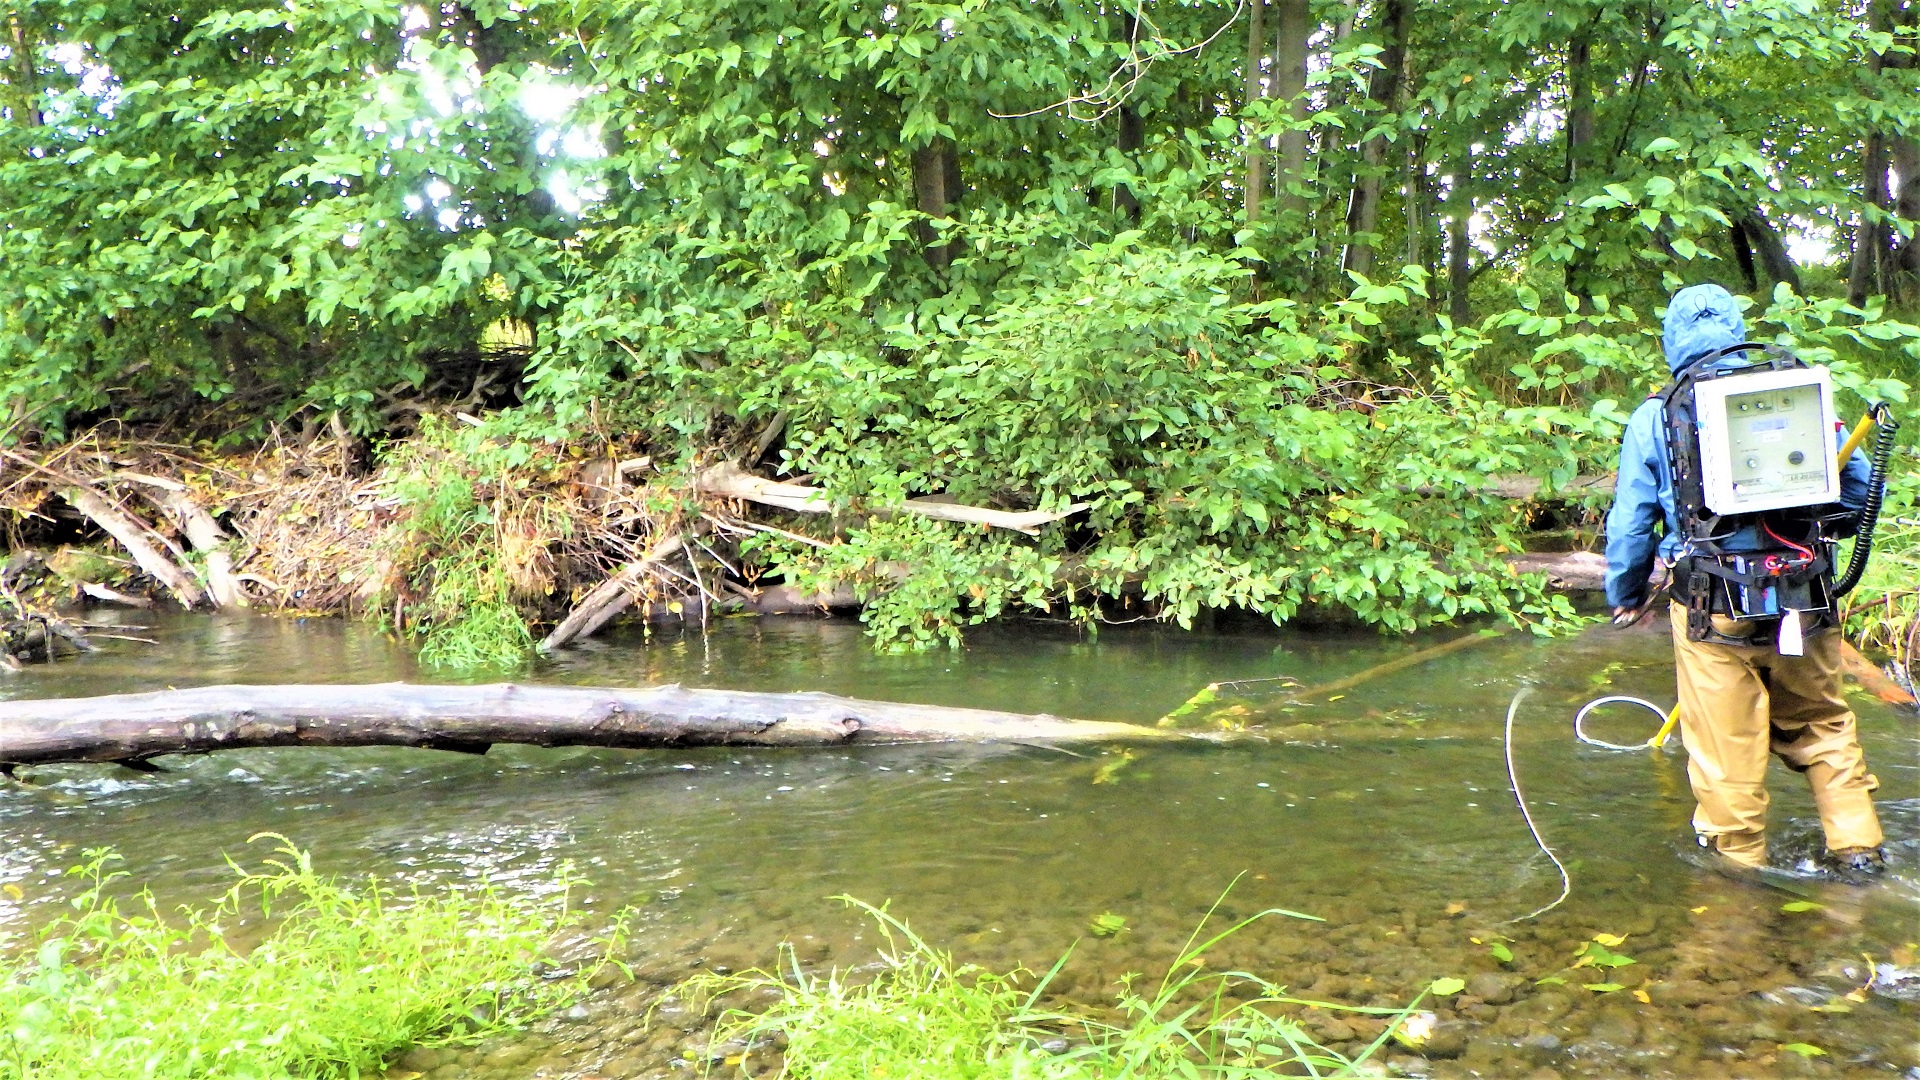
Crews electrofish on the Walla Walla River.
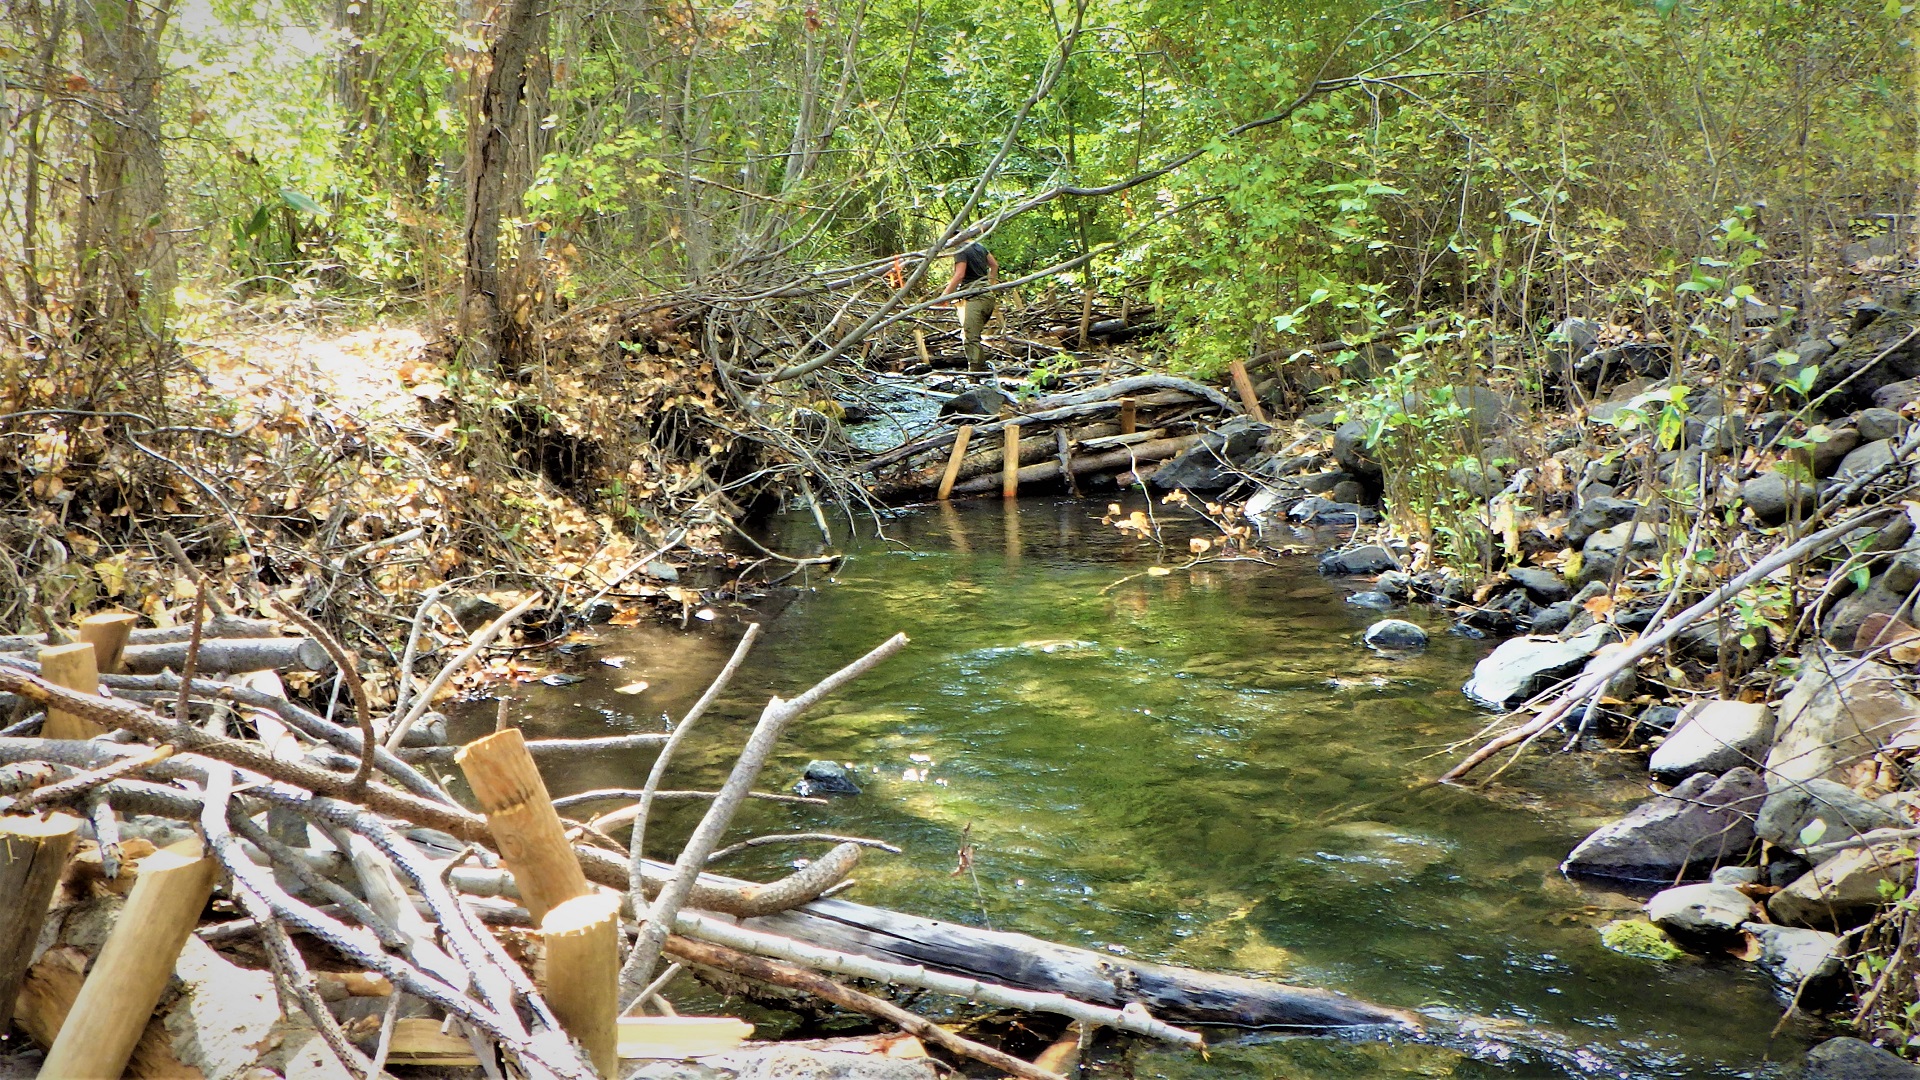
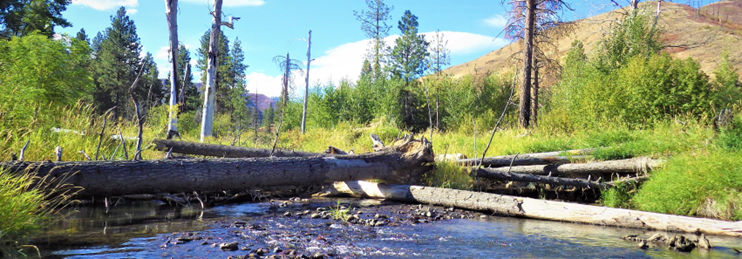
Large woody debris restoration on the south fork of Asotin Creek will give structure for retaining sediments and provide fish habitat.
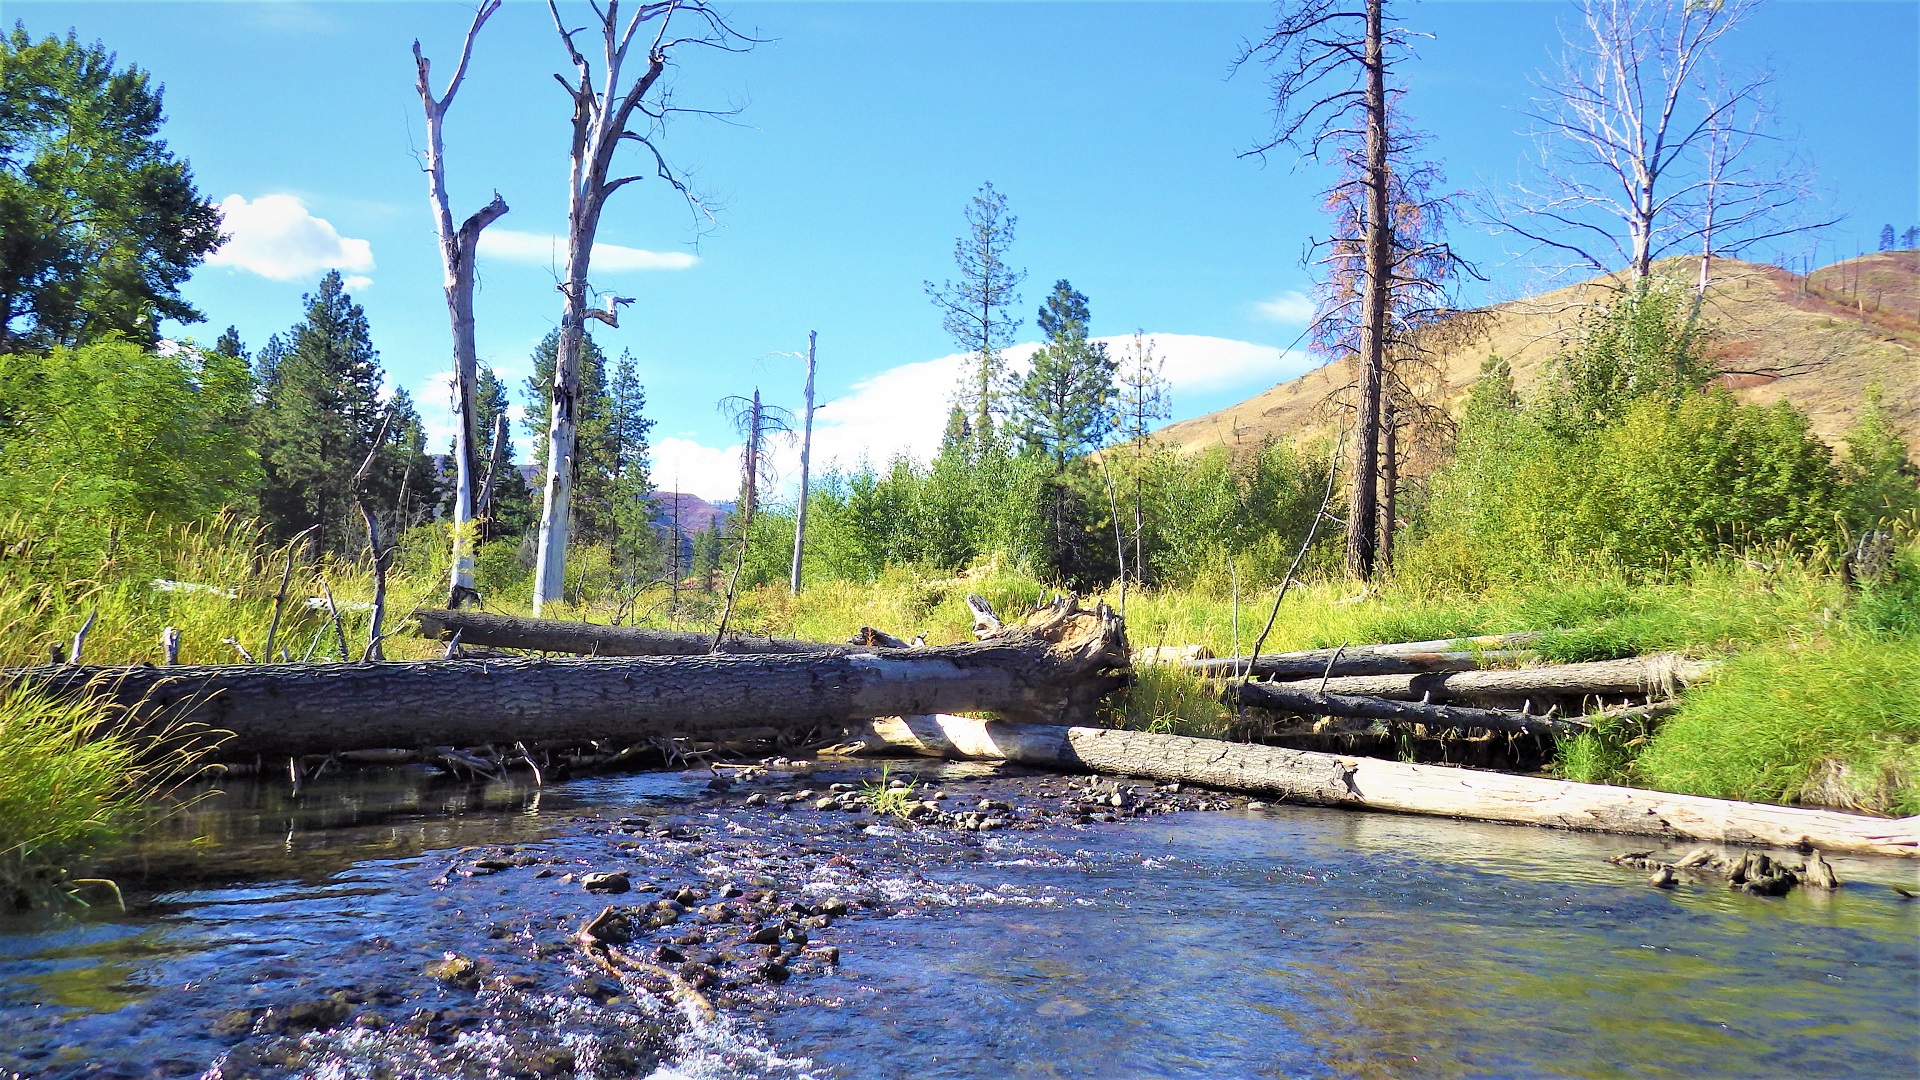
Large woody debris on the Tucannon River retains substrate, slows high flows, and provides cover for fish and other animals.
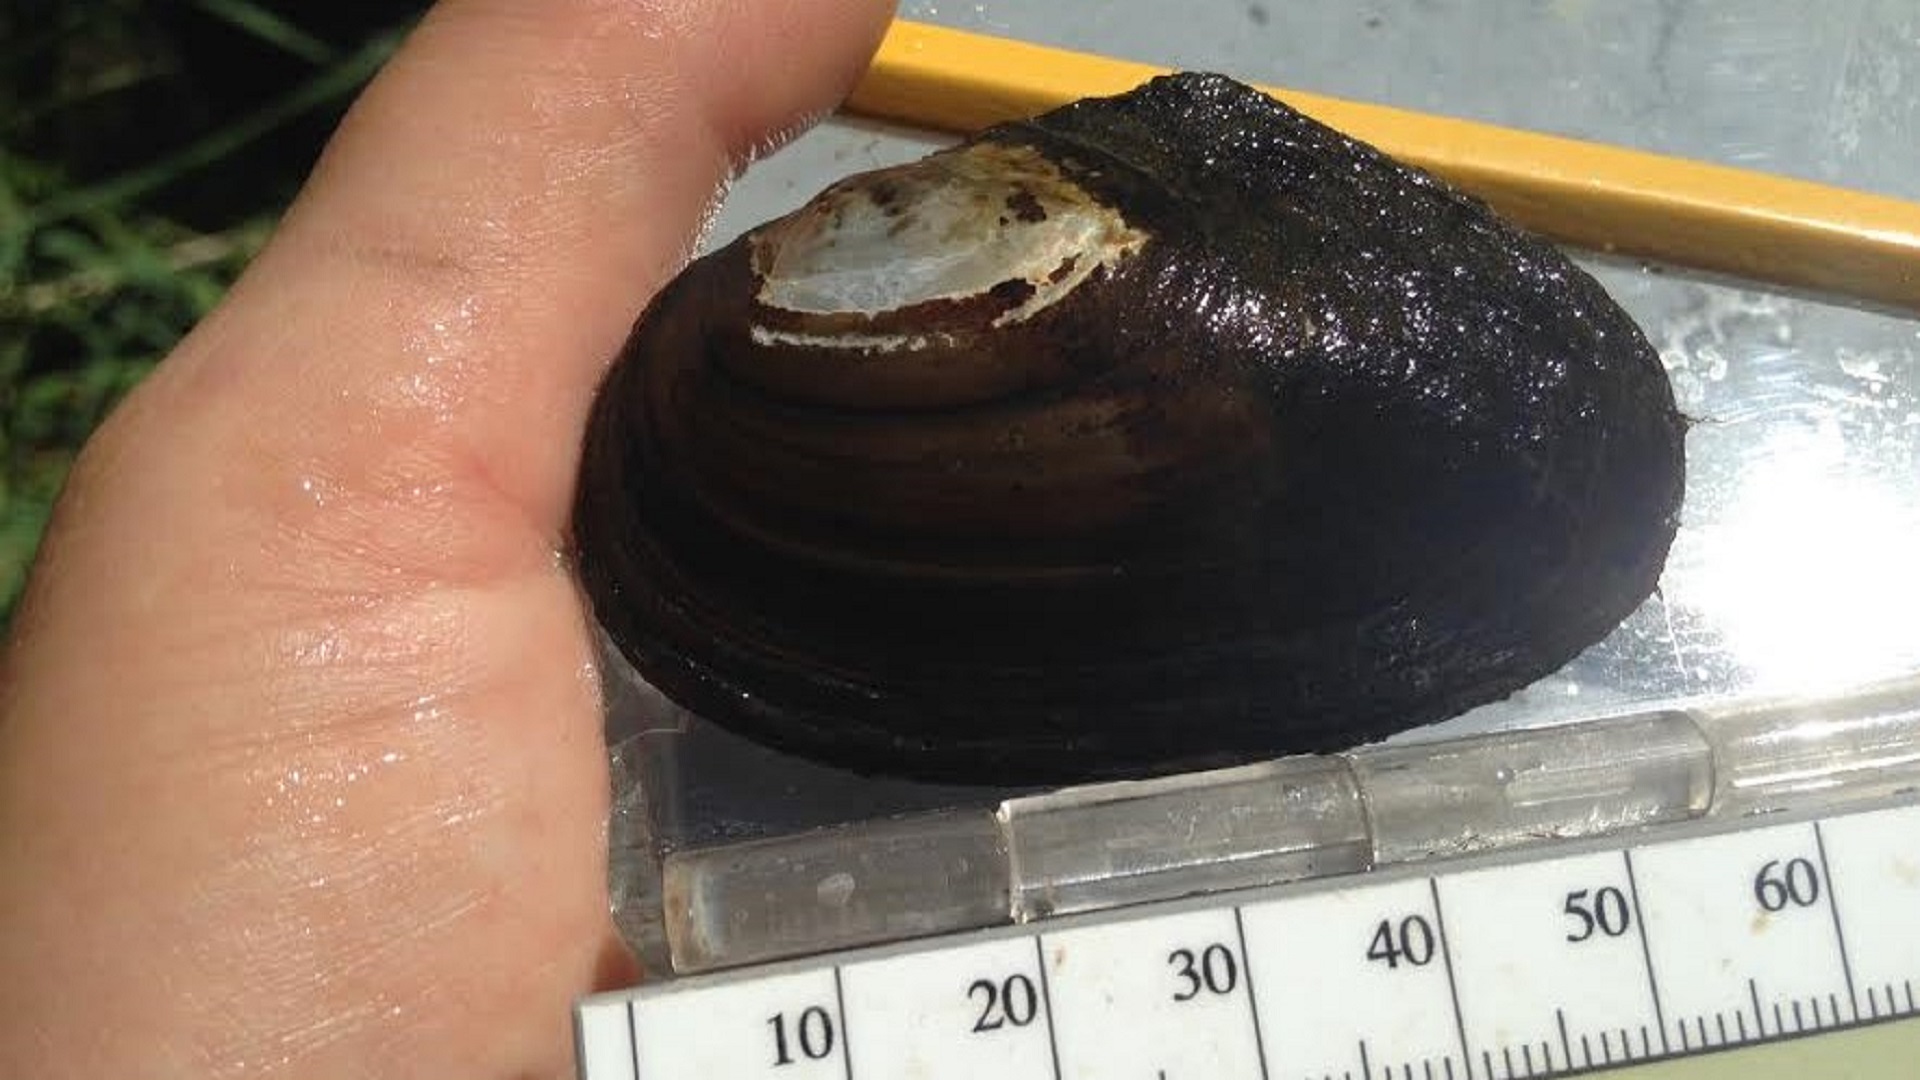
This freshwater mussel was found in the sediment at Dry Creek.
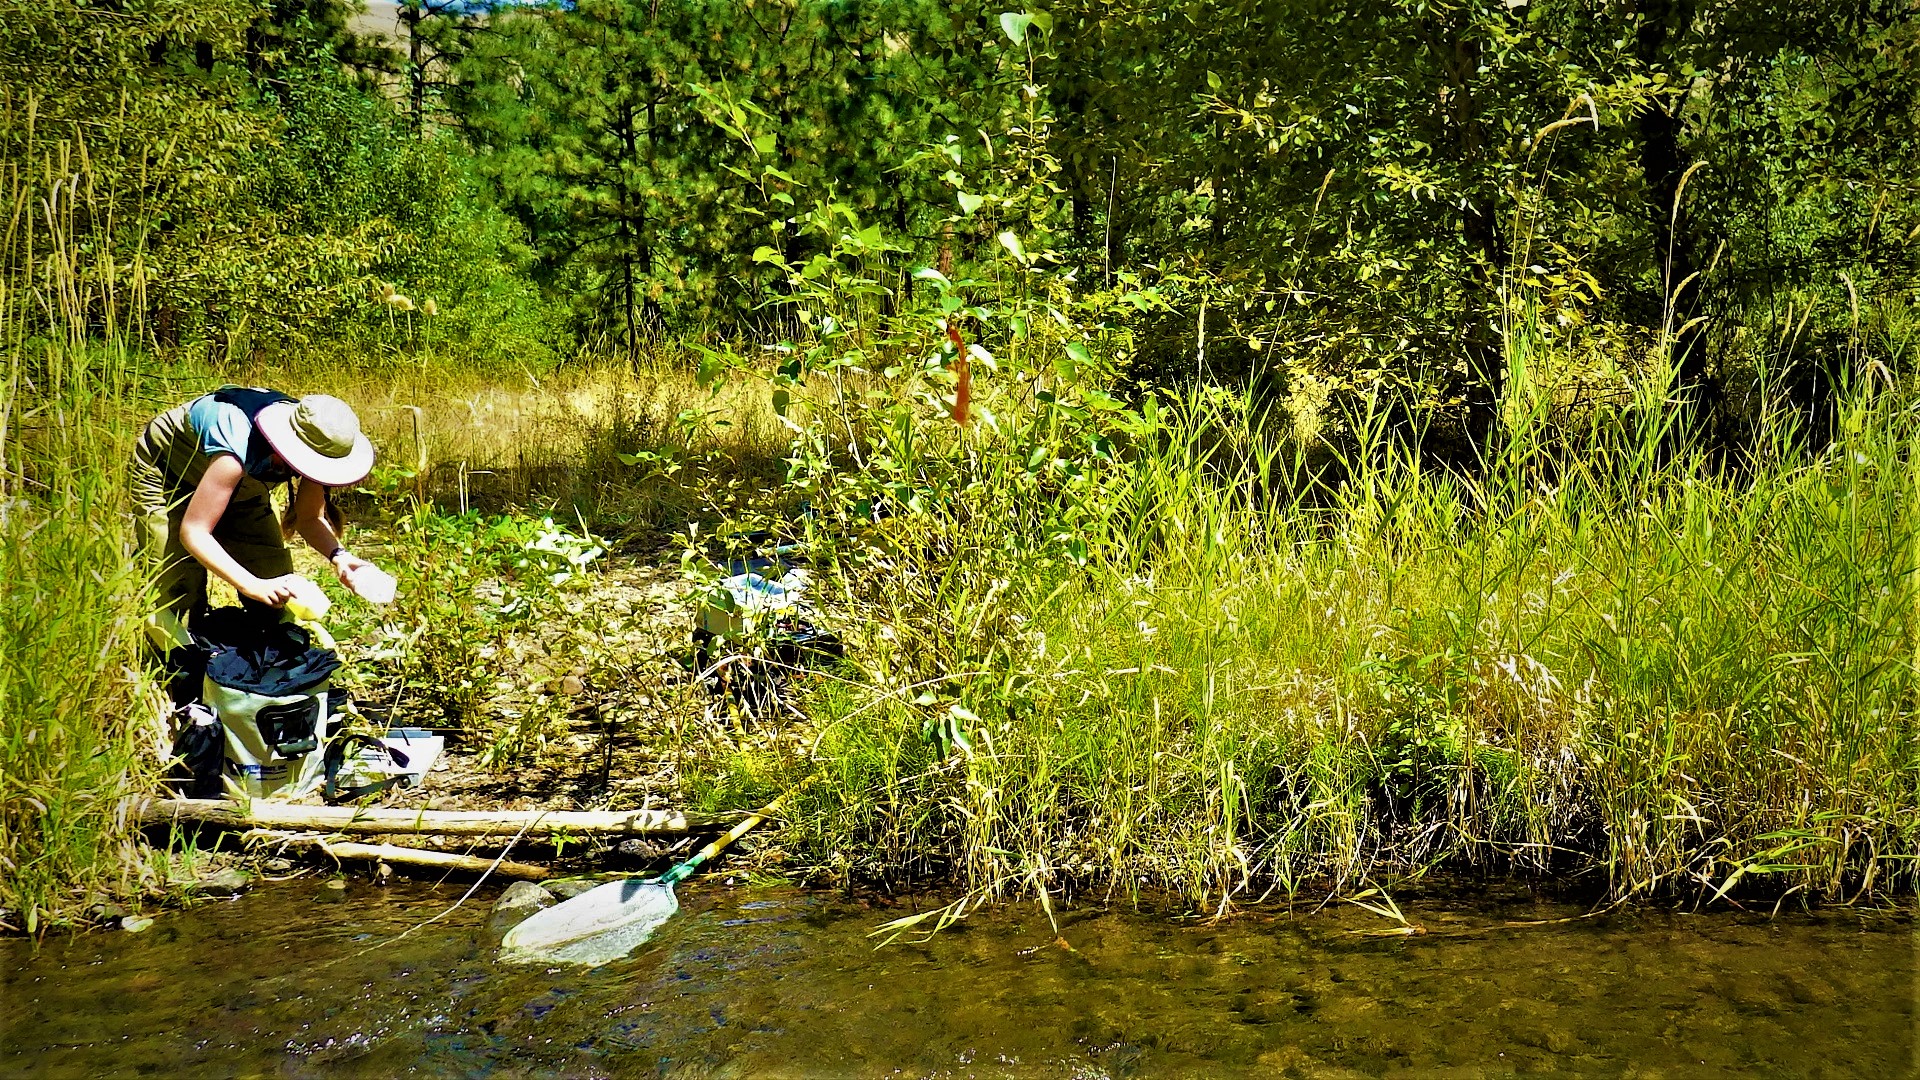
Crewmember prepares supplies for a fish-assemblage survey.
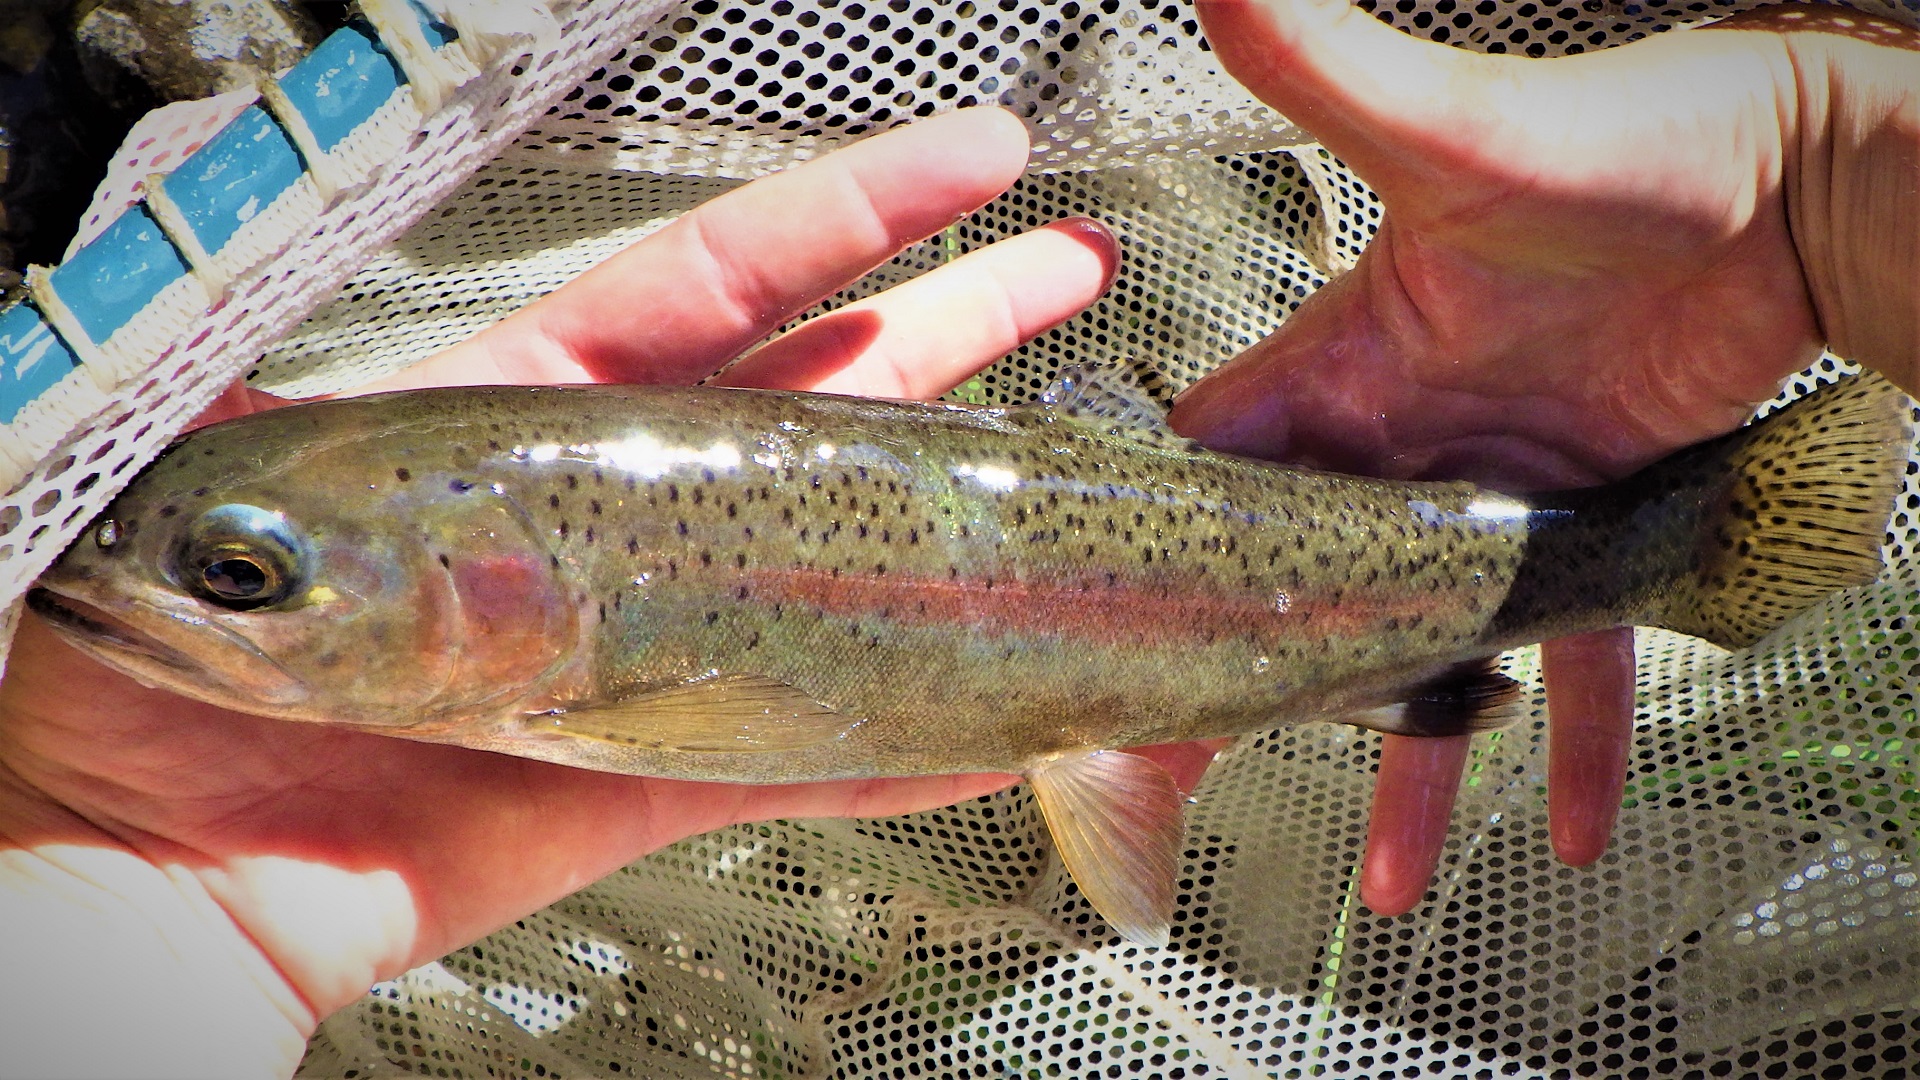
An adult rainbow trout from the Tucannon River is a sign of a healthy stream.
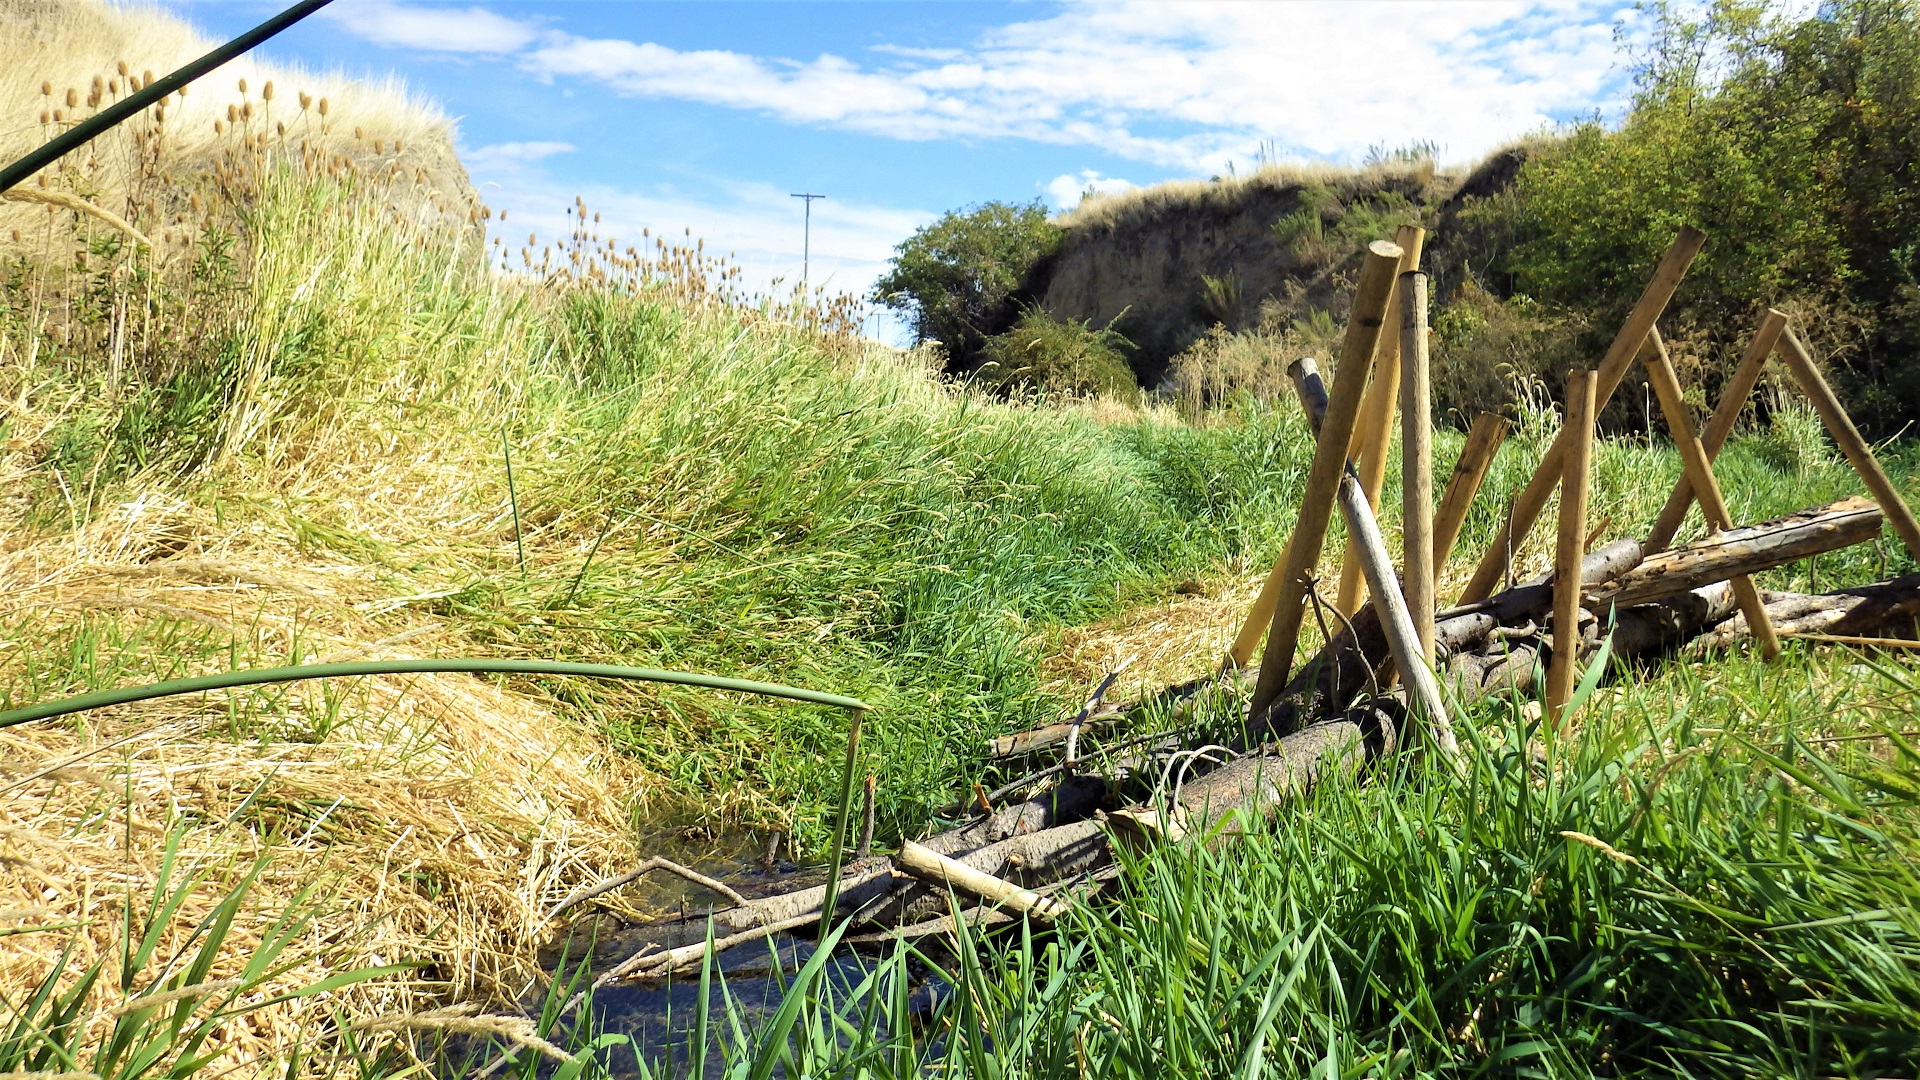
This restoration project at Pataha Creek has large woody debris secured with structures to hold up during high flows.
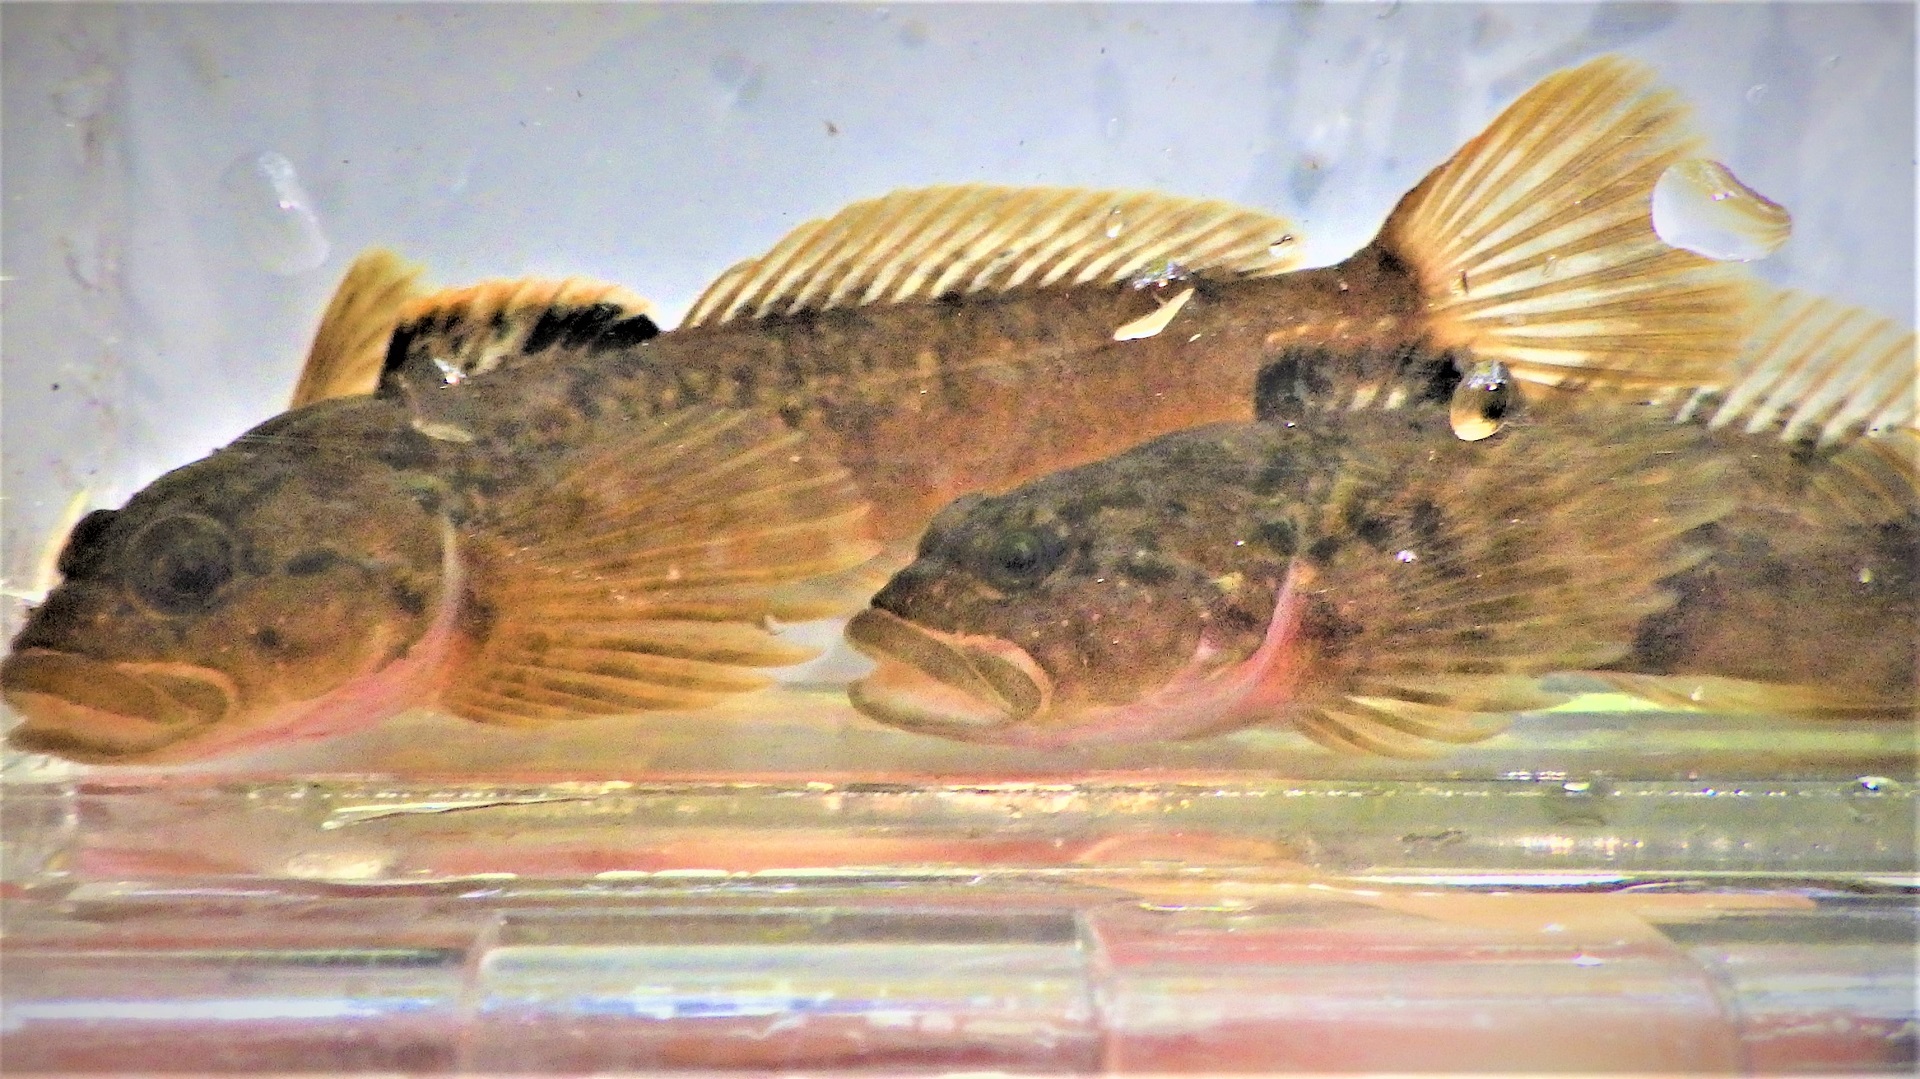
Charley Creek has an abundance of Paiute sculpin.
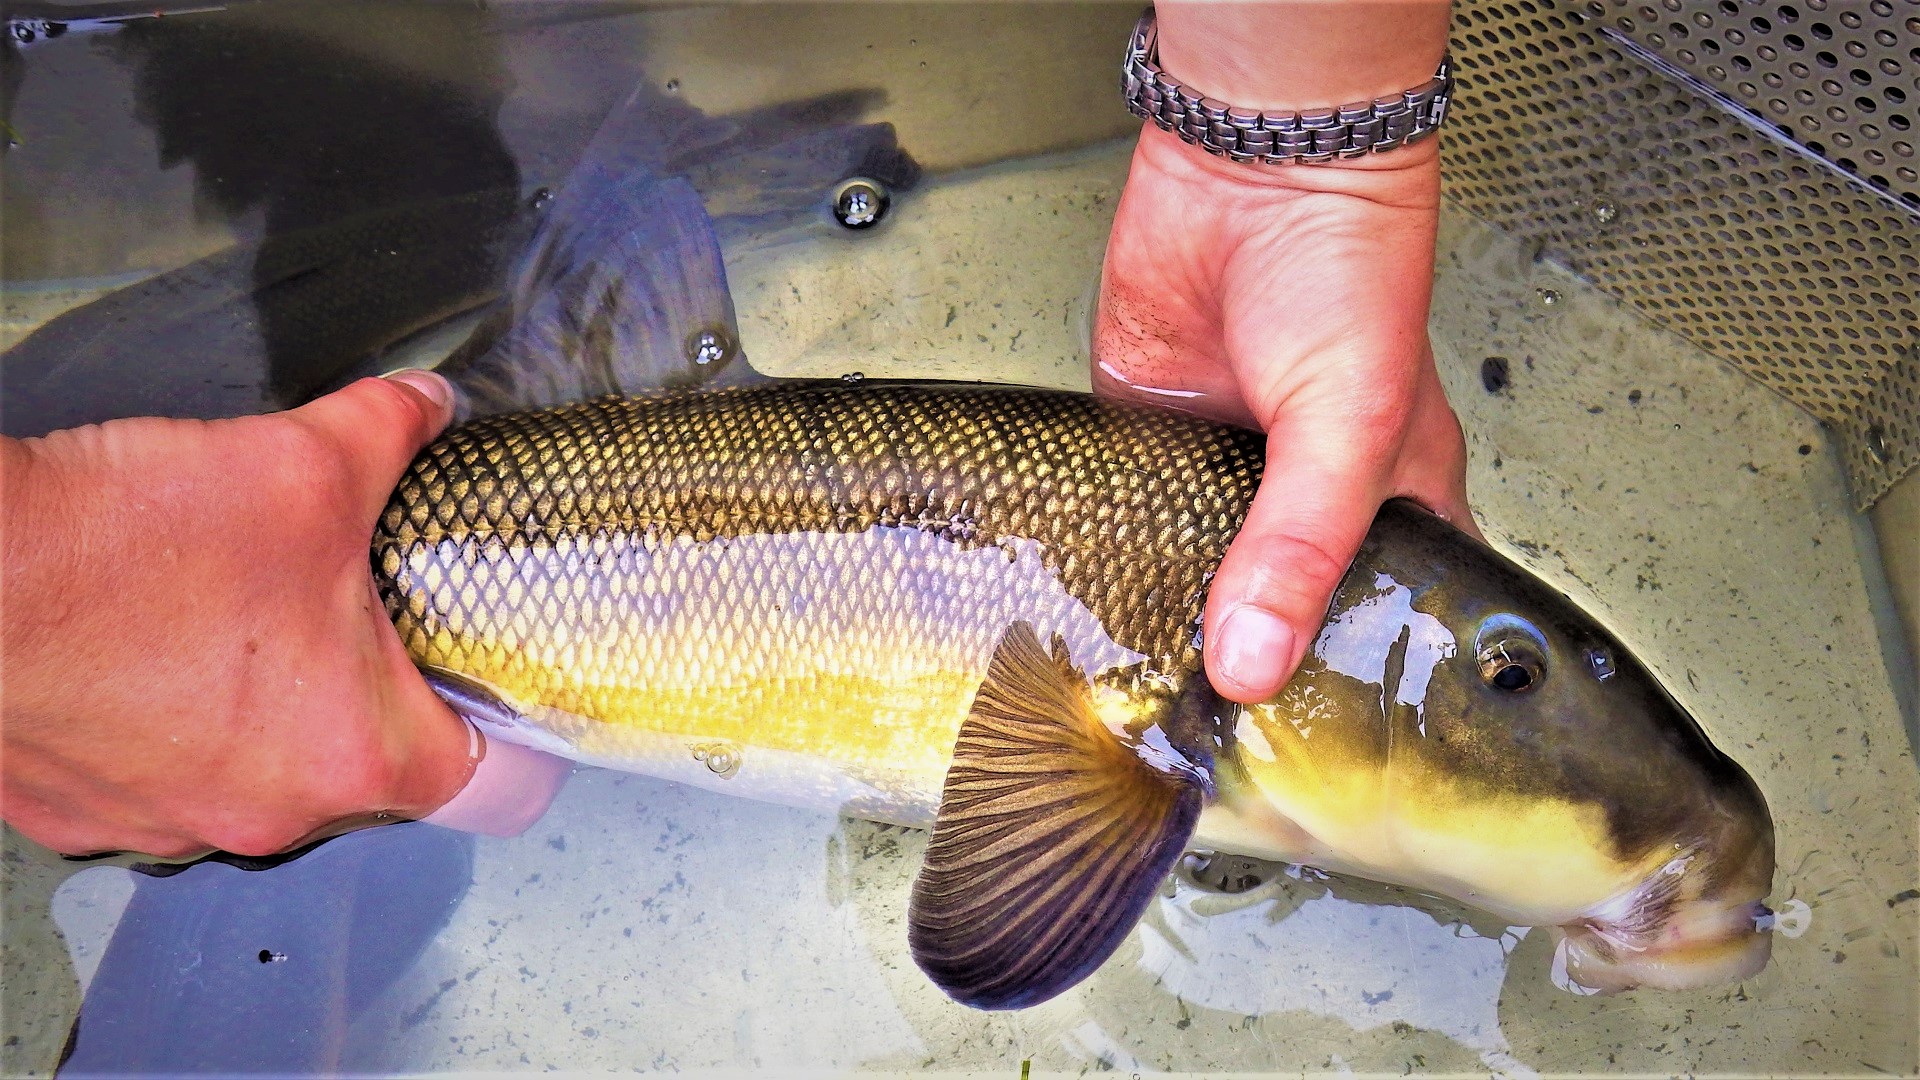
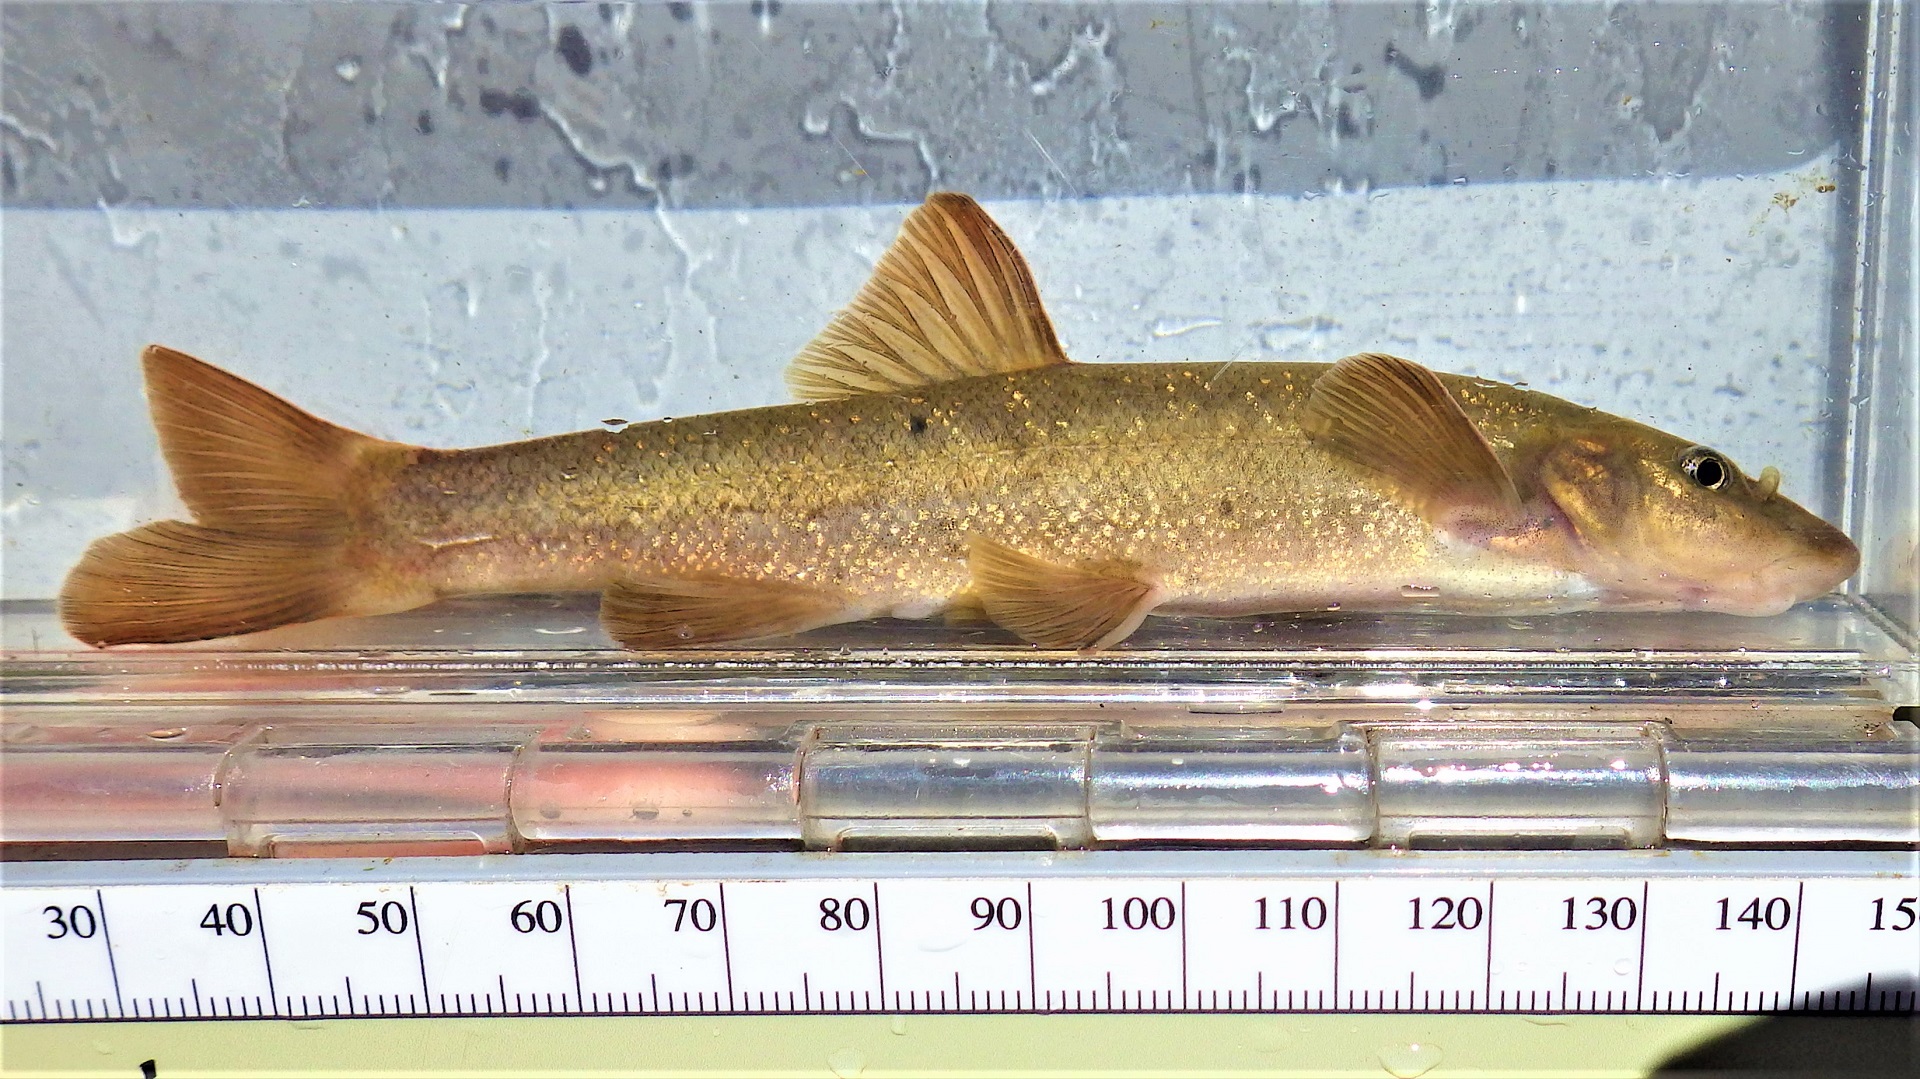
Largescale suckers, like this one from the Snake River, need cool clean water to spawn and thrive.
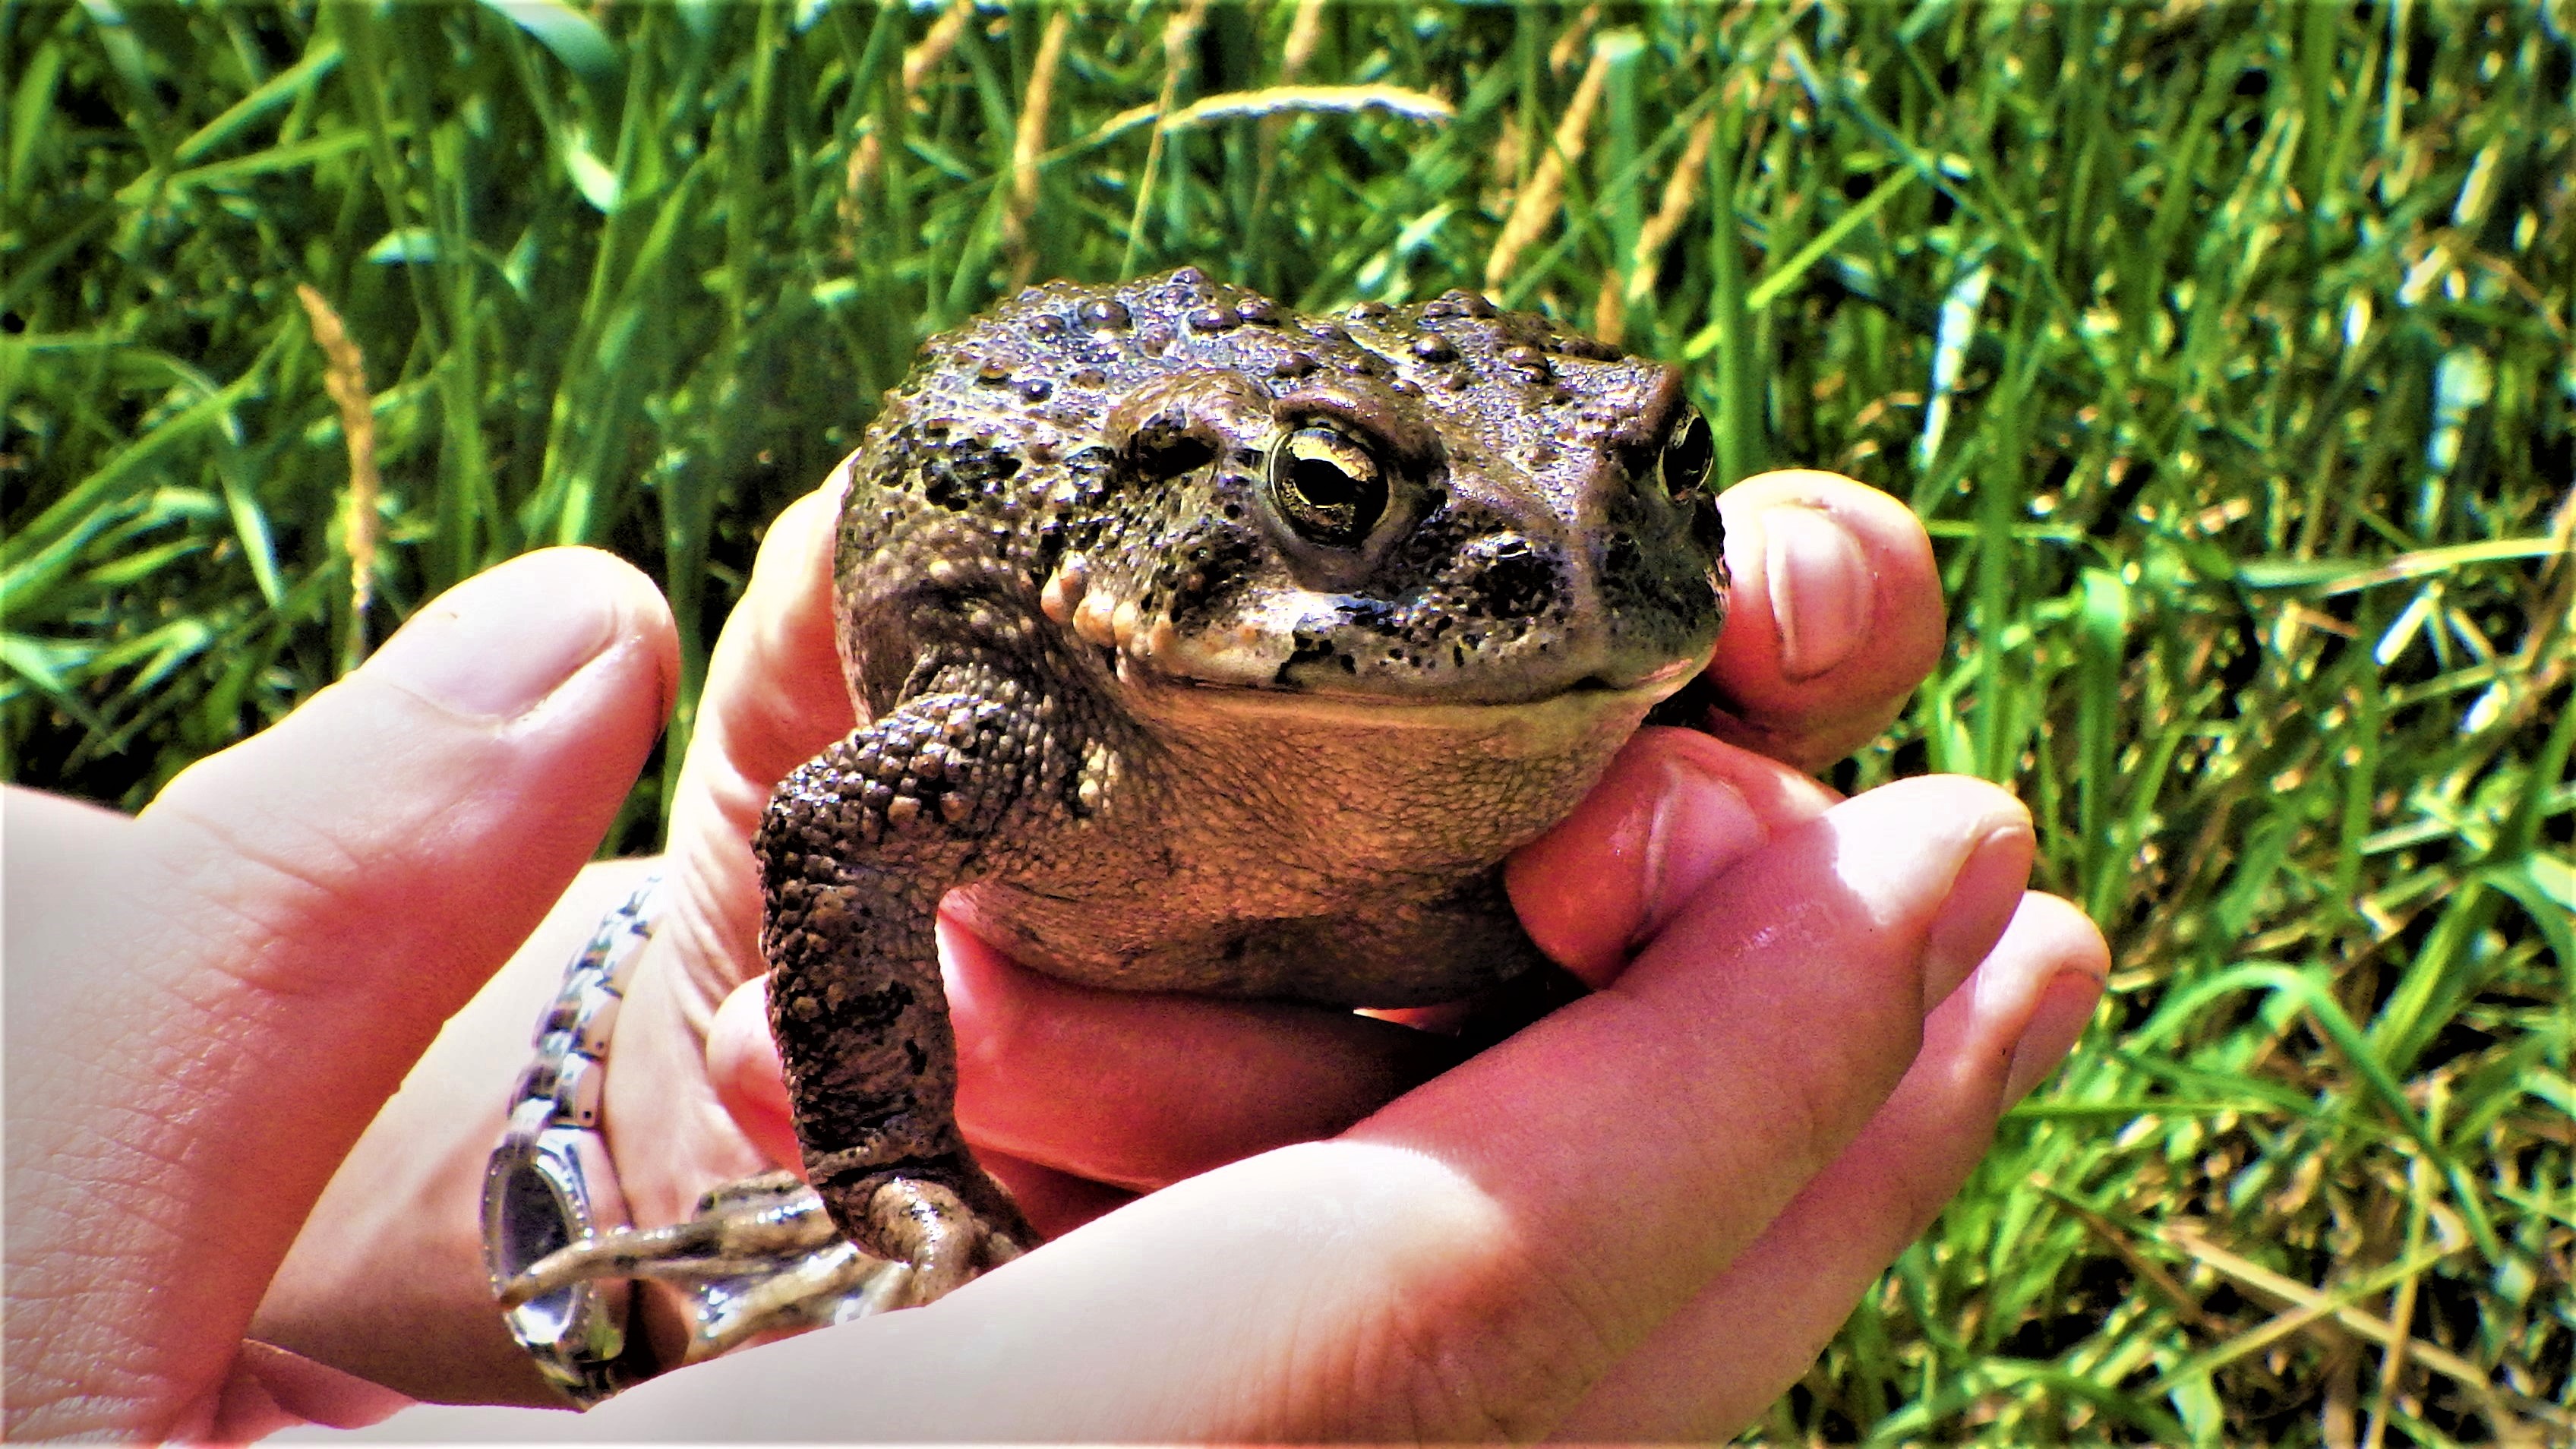
A large western toad from Deadman’s Gulch indicates a healthy stream. These species are found in cooler water and are impacted by a changing climate.
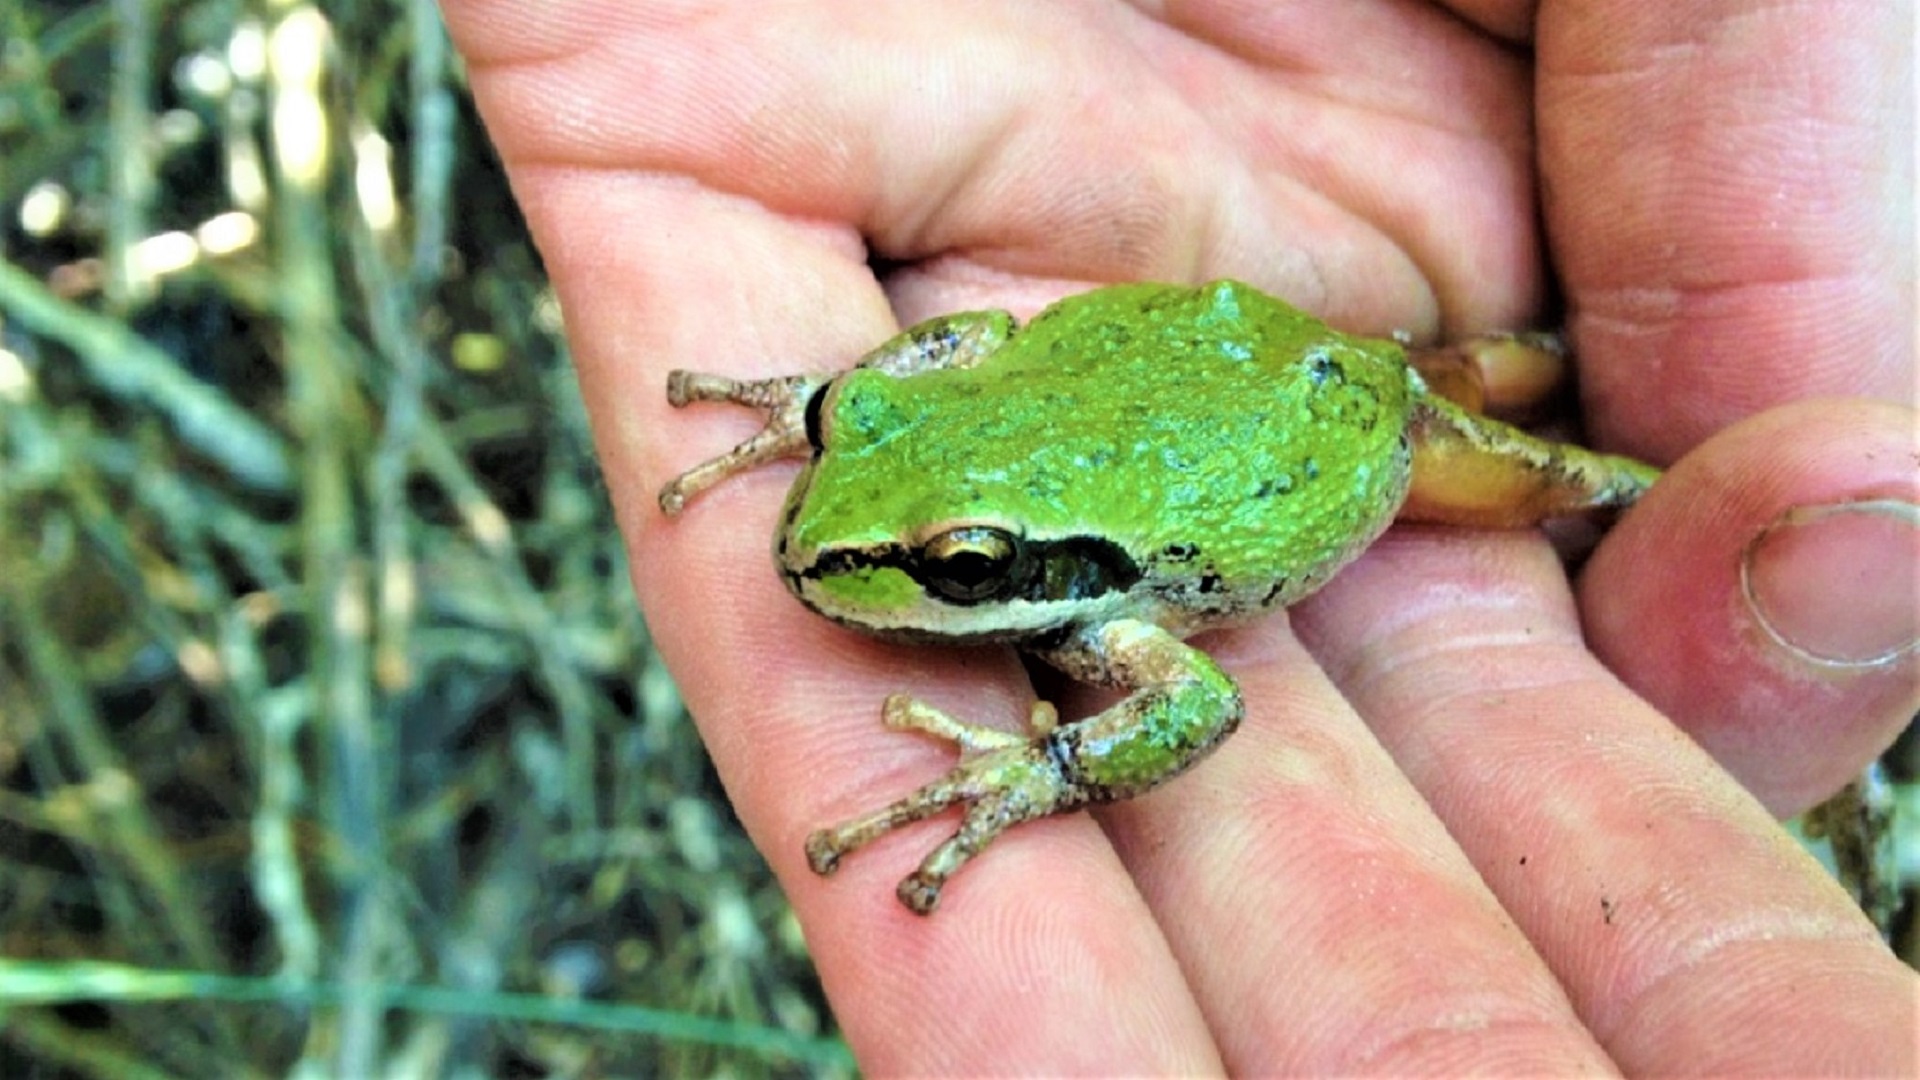
Pacific treefrogs prefer moist habitats, such as Casey Creek.
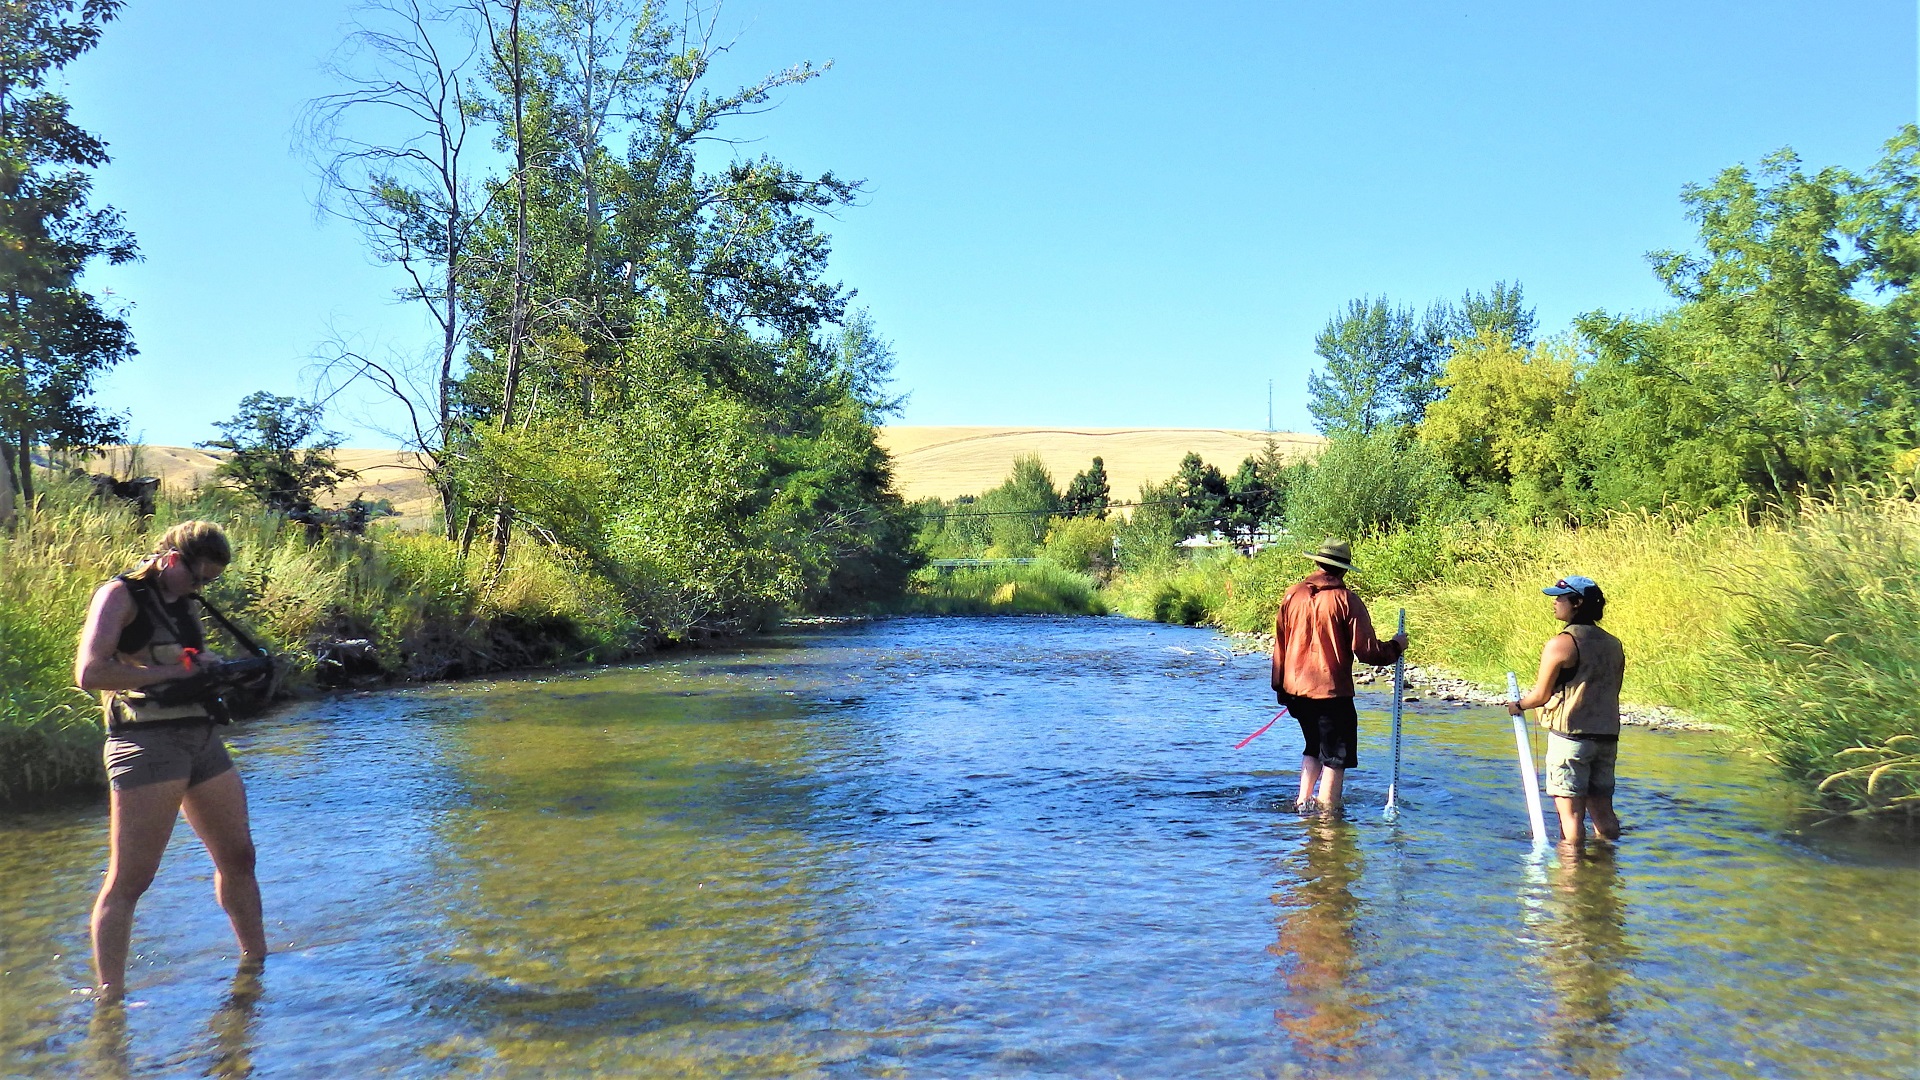
Crews survey the Touchet River.