

Watershed health — Mid-Columbia update
We investigated the health of stream habitats in the Mid-Columbia Status and Trends Region in 2011 and 2015. From these study years, the region showed streams to be in mostly good biological condition, but also showed increasing stressors from human impact.
Use the map to navigate our reports by Status and Trends Region.
Regional summary
- B-IBI scores in the Mid-Columbia Region show that a majority of streams are in good biological condition.
- The most prevalent stressors for streams in the Mid-Columbia Region were elevated water temperatures, higher phosphorous concentrations, higher proportion of sand/fines, human influence, and low canopy cover.
Biological condition
Invertebrate biological condition of streams, as assessed with B-IBI scores, did not change significantly from 2011 to 2015 in the Mid-Columbia Region. For both rounds of sampling, most streams had good B-IBI ratings. The proportion of streams in poor condition decreased, and those in fair condition increased. These are positive trends that will require more data to validate.
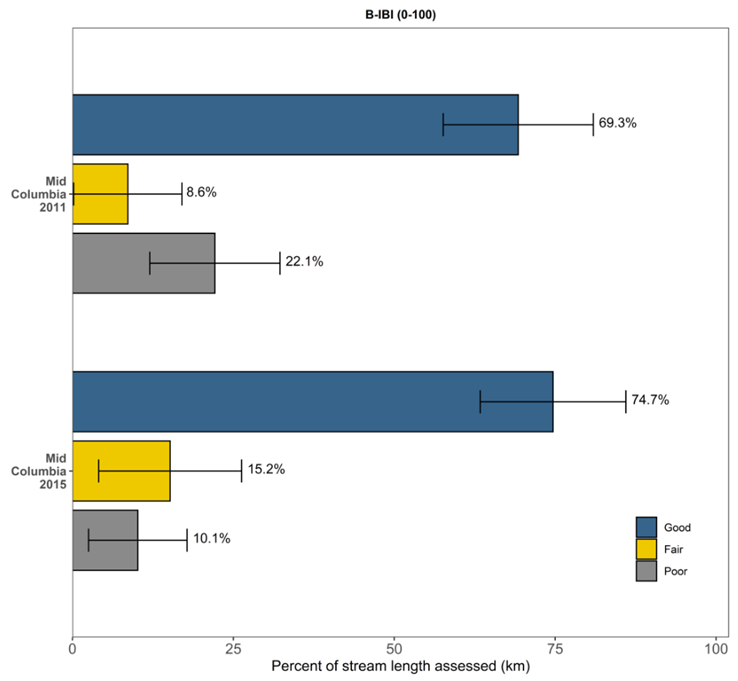
We used B-IBI ratings from 2011 and 2015 to obtain the percentage of stream kilometers in good, fair, and poor conditions for the Mid-Columbia Region. Error bars represent 95% confidence intervals.
Significant physical and chemical stressors
In the Mid-Columbia Region, warm water temperatures continue to be one of the leading physical stressors, with more than half of streams showing elevated values. Although not significant, the number of stream kilometers with eleveated phosphorus and sand or fine sediments increased between 2011 and 2015. Additionally, some of the other most common physiochemical stressors in this region were those associated with water quality, reduced canopy and fish cover, and human influence.
To interact with this graph and learn more about these physiochemical stressors, hold your mouse over each bar.
This interactive graph shows the percentage of stream kilometers assessed with poor physiochemical conditions in the Mid Columbia Region for 2011 and 2015. The x-axis represents the percentage of river extent in poor condition. Error bars show 95% confidence intervals.
Flip through our field photos!
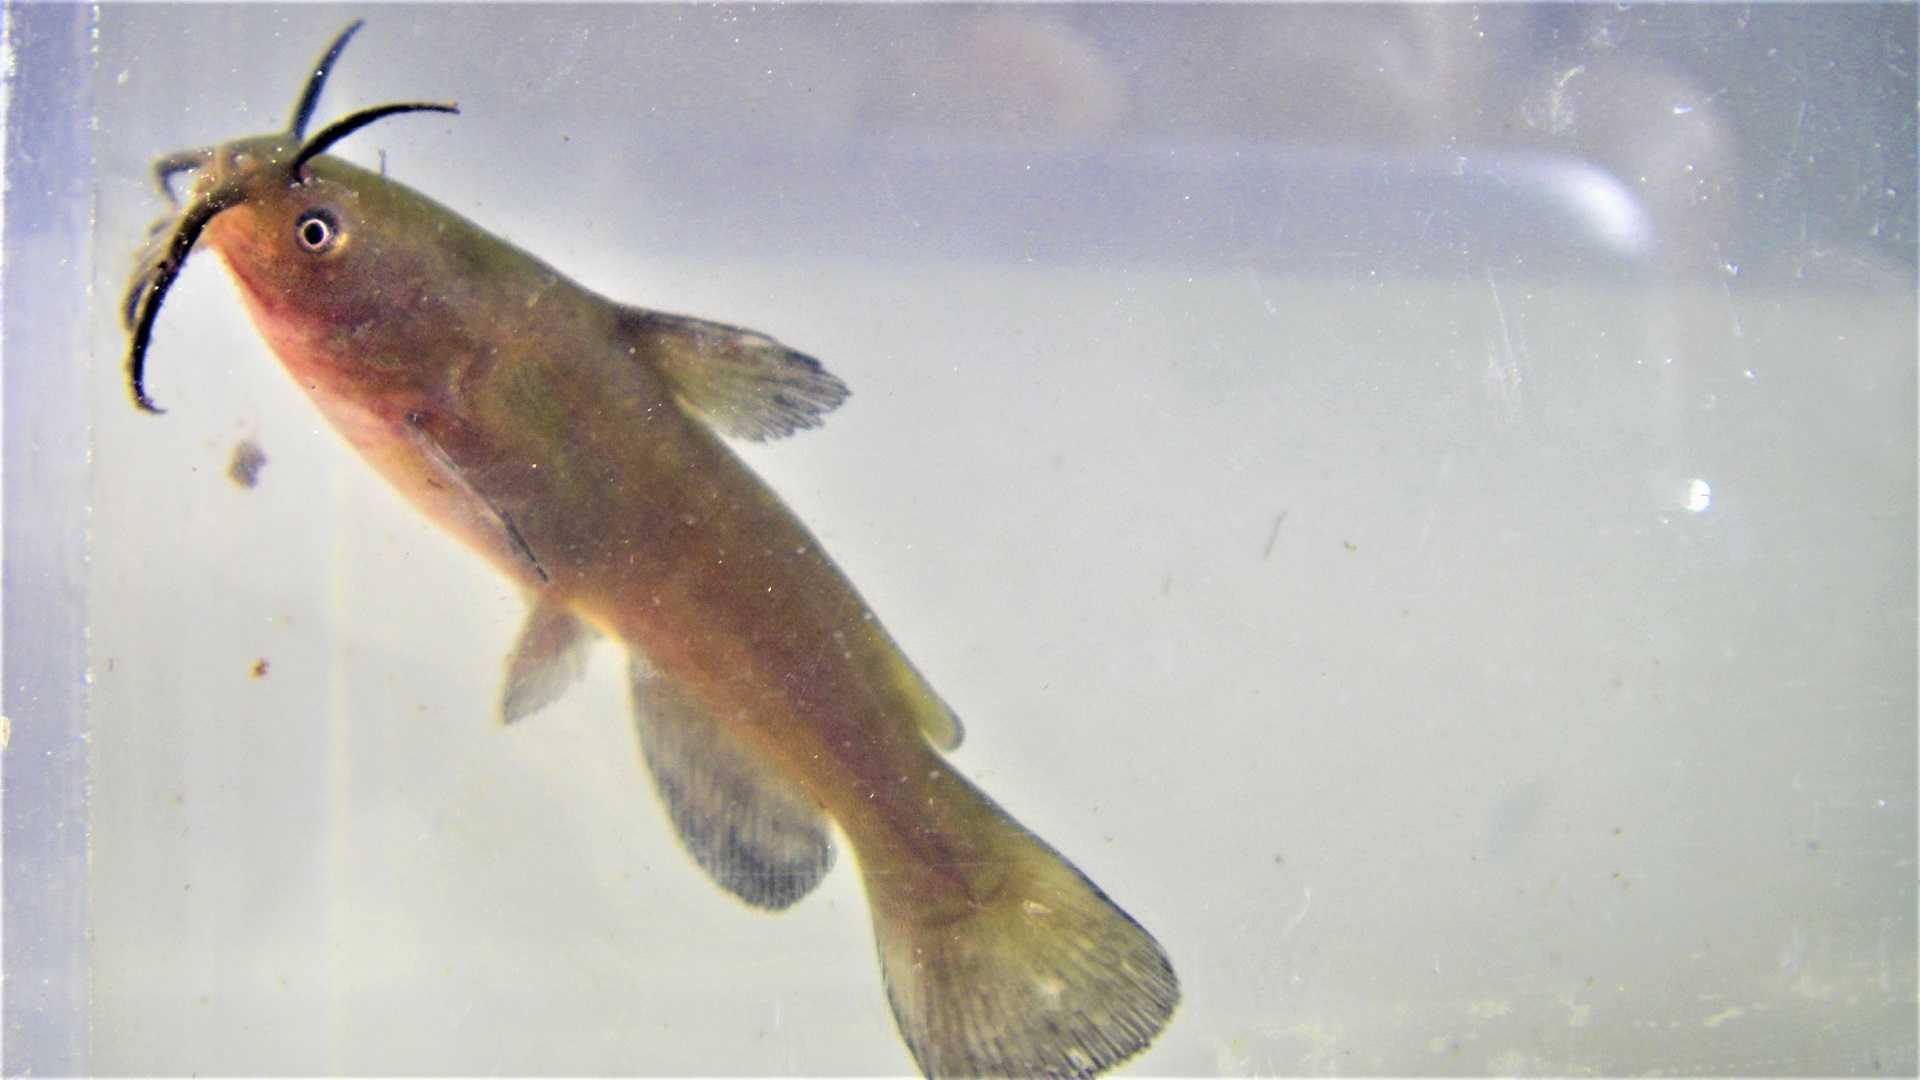
This black bullhead was found at Holmes Creek.
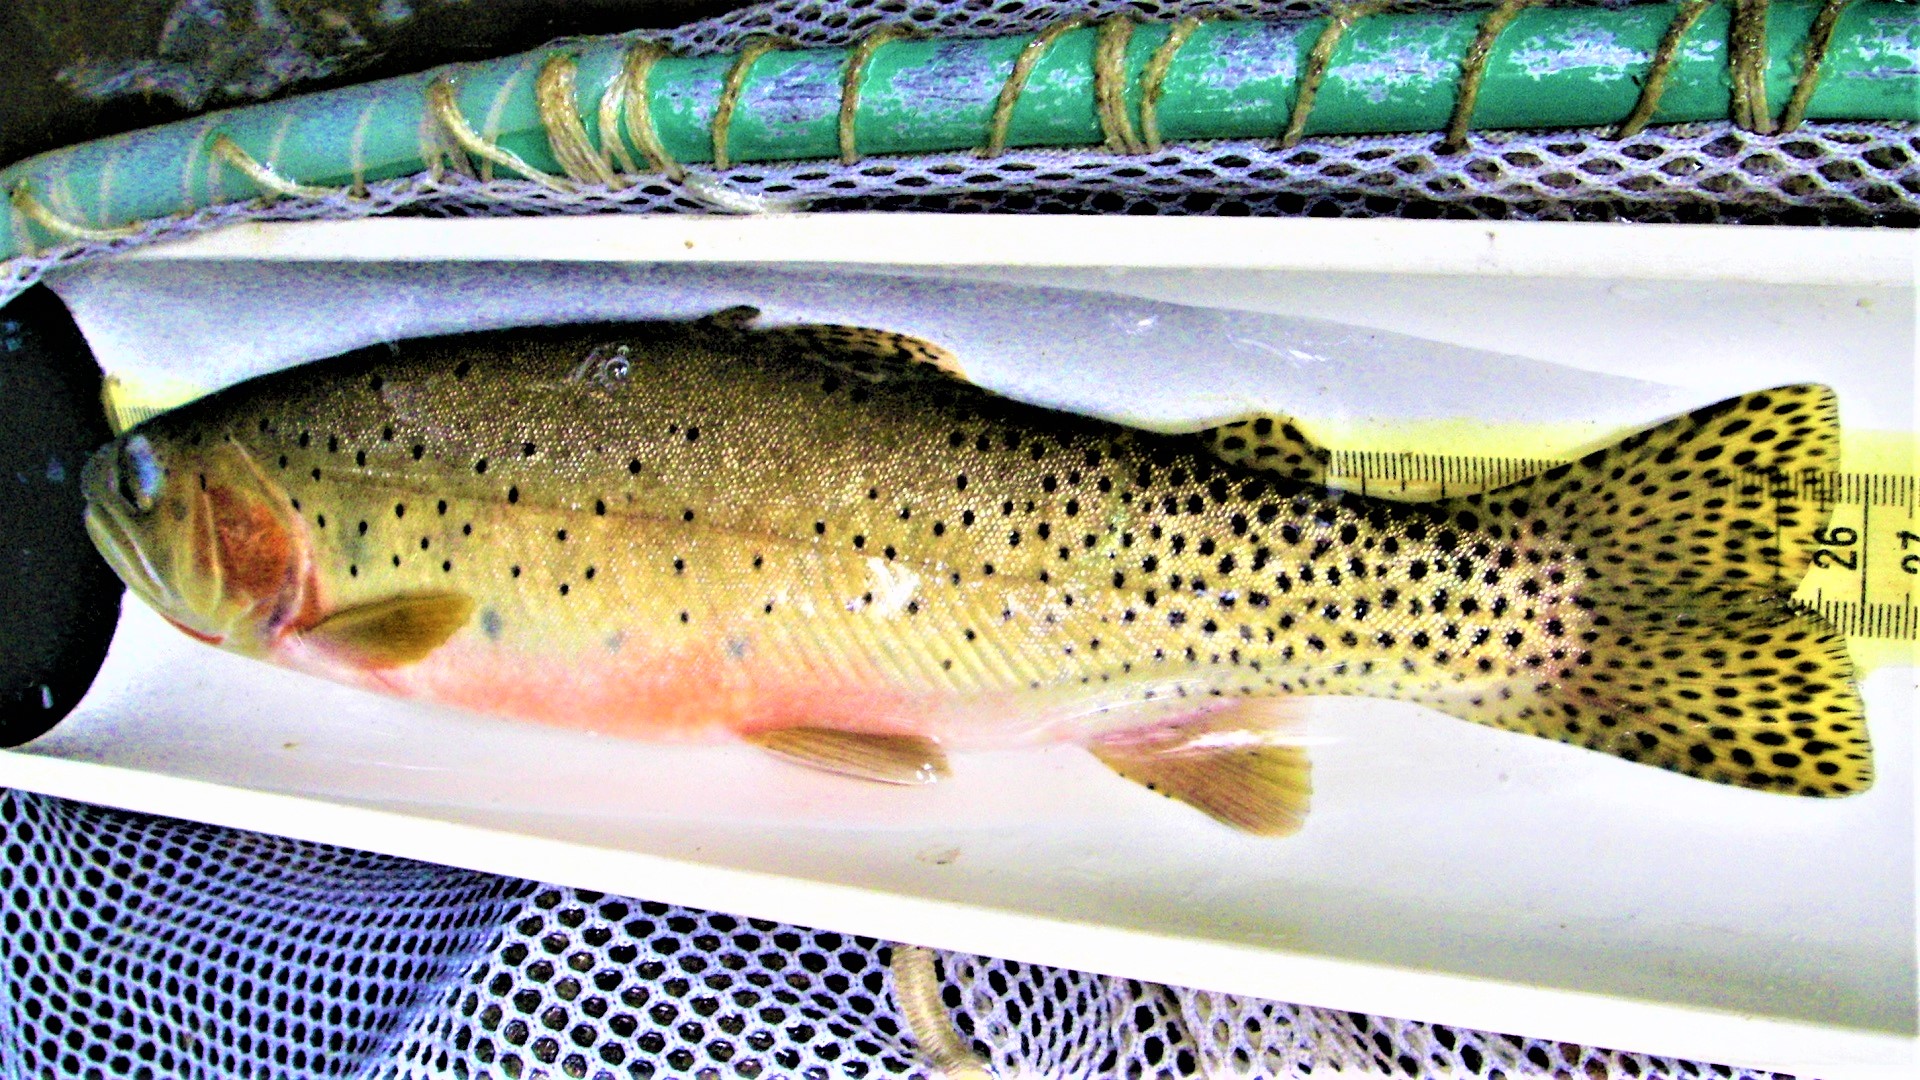
A crewmember measures the length of this adult westslope cutthroat trout from Blowout Creek.
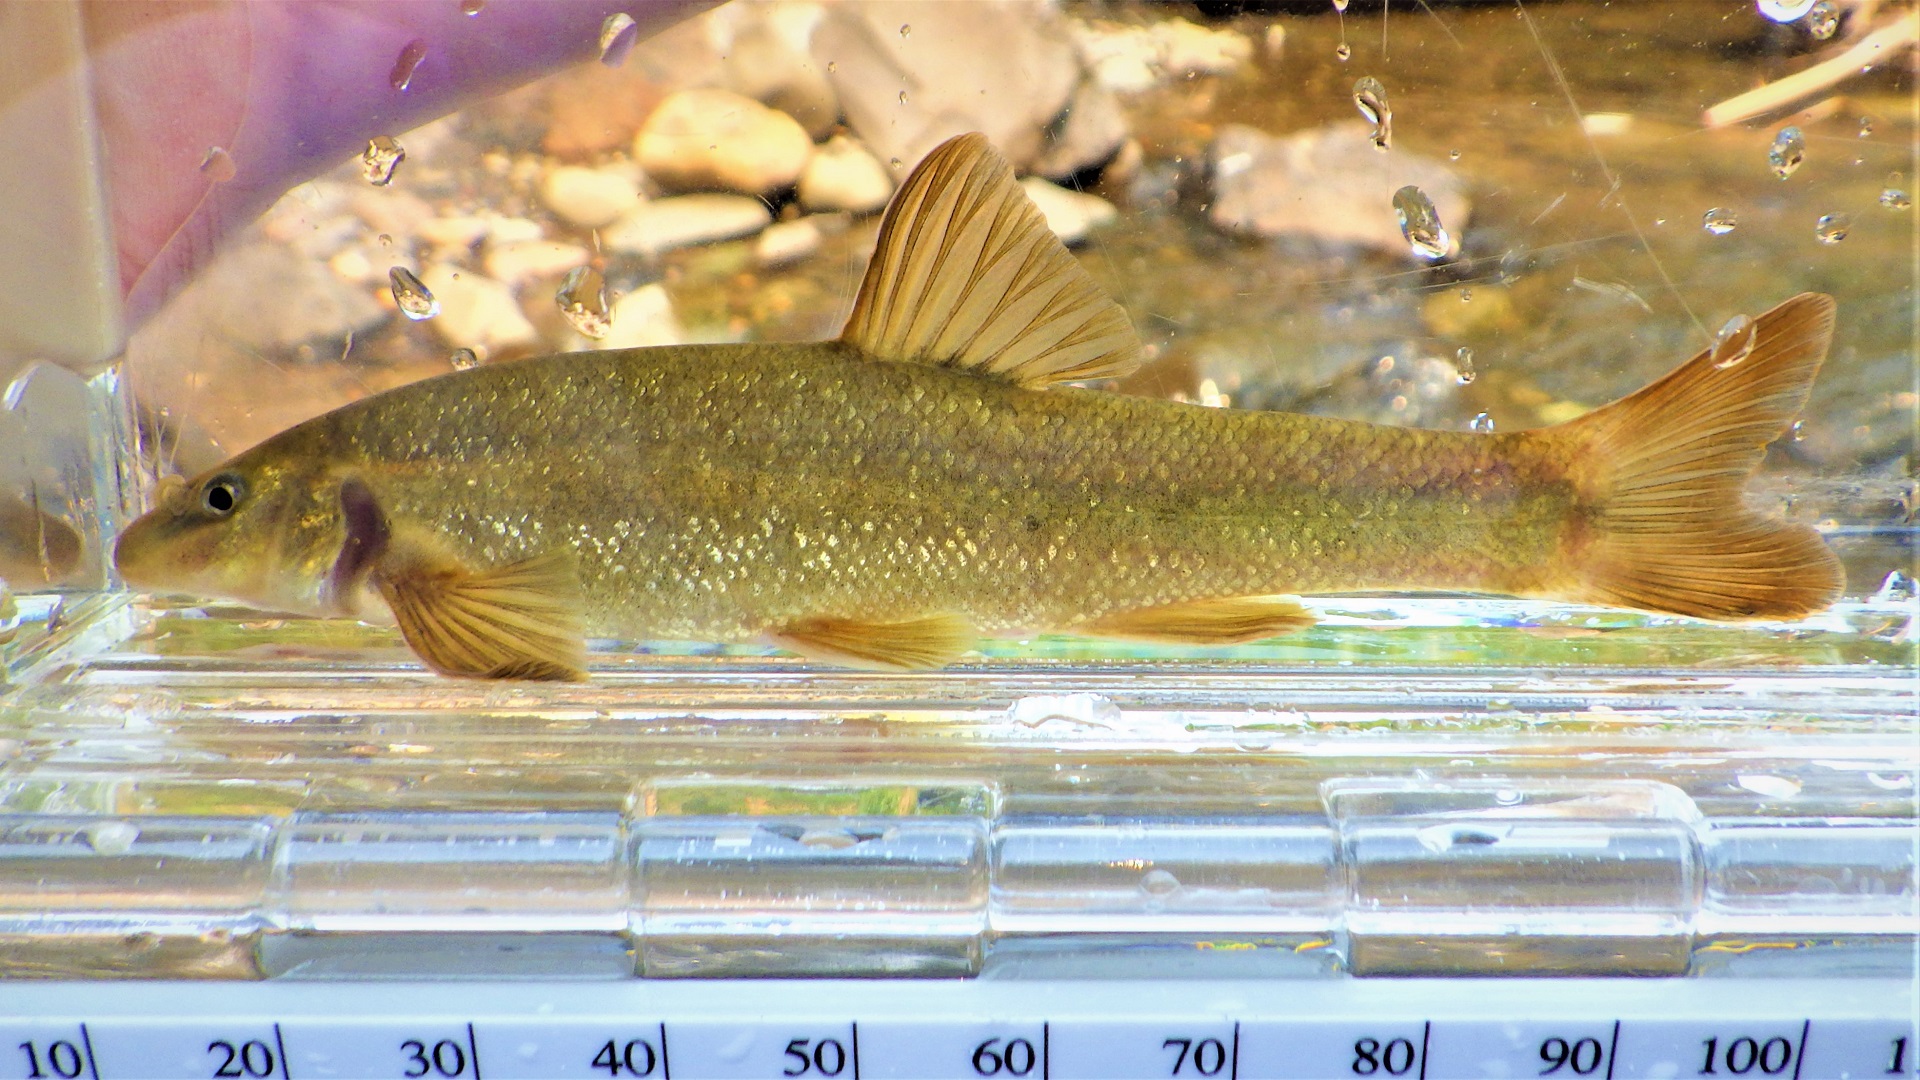
A longnose dace from the Teanaway River indicates a healthy stream.
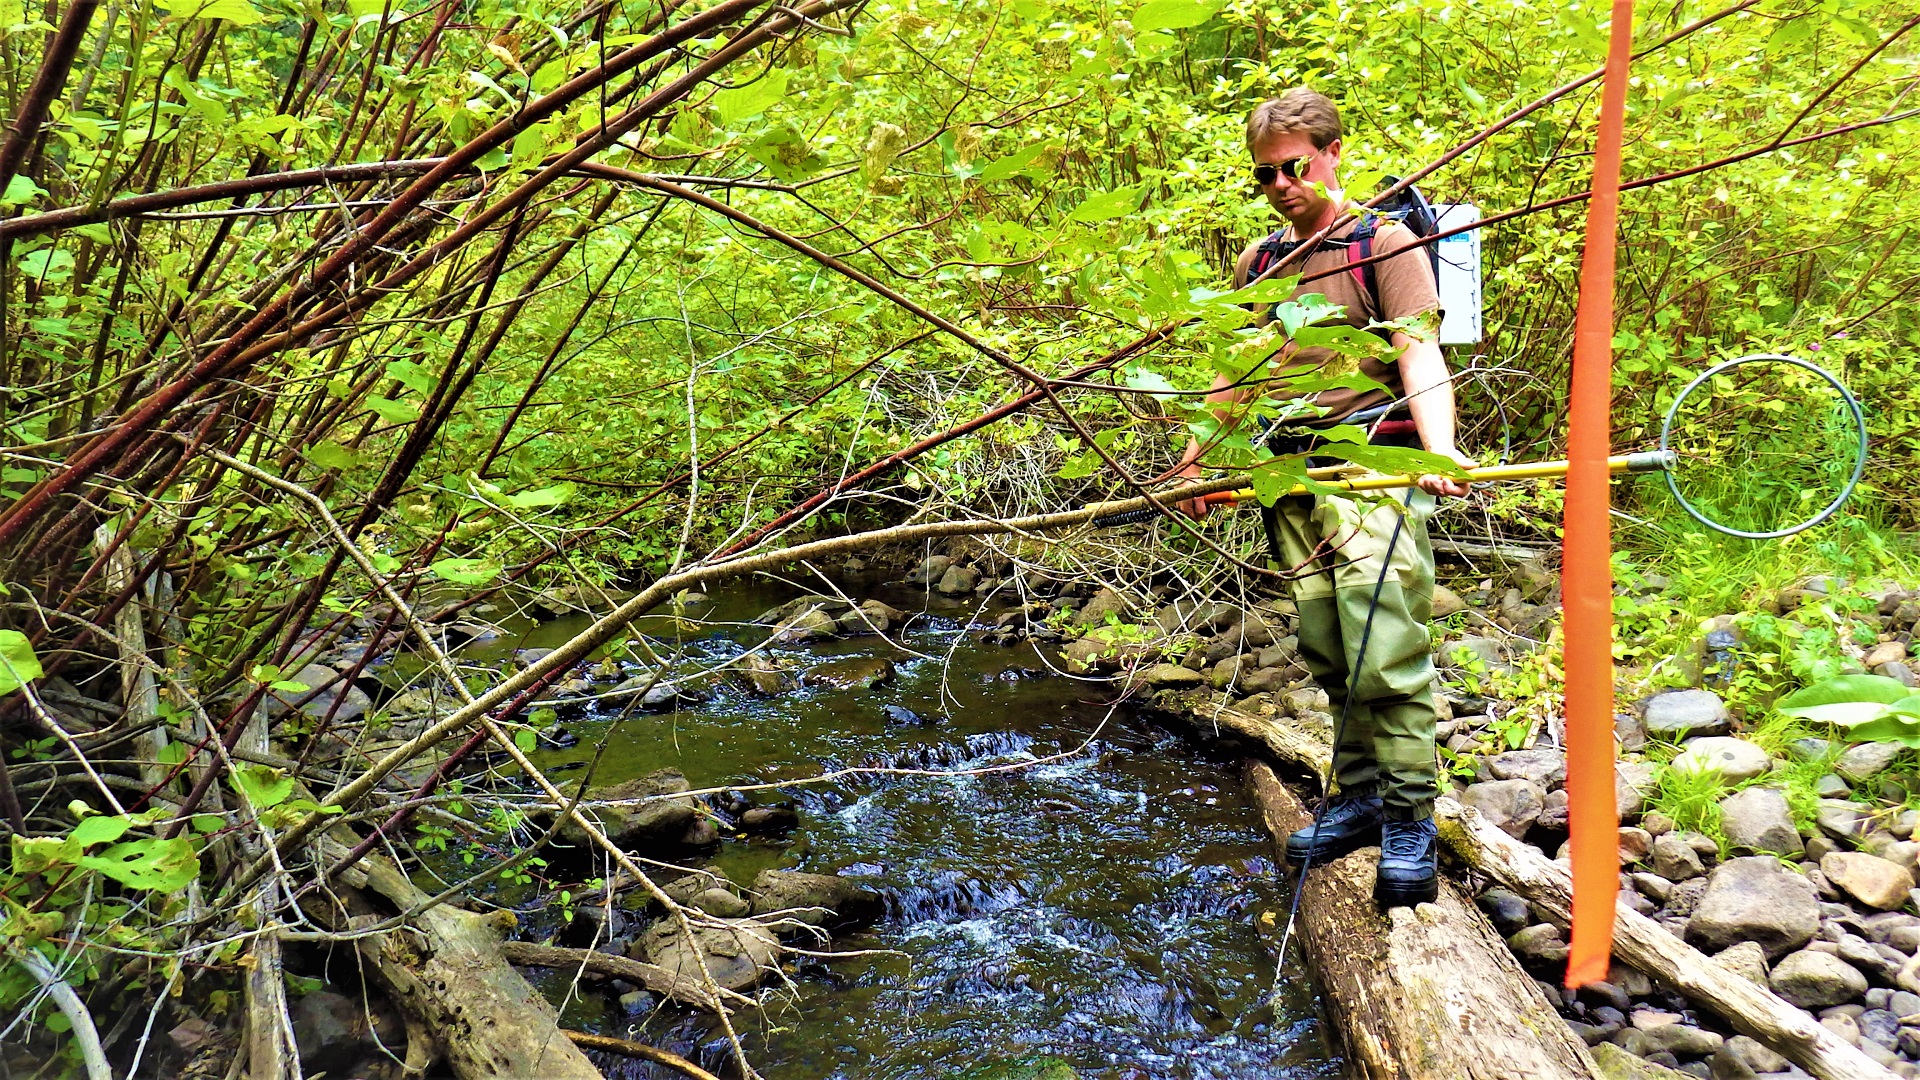
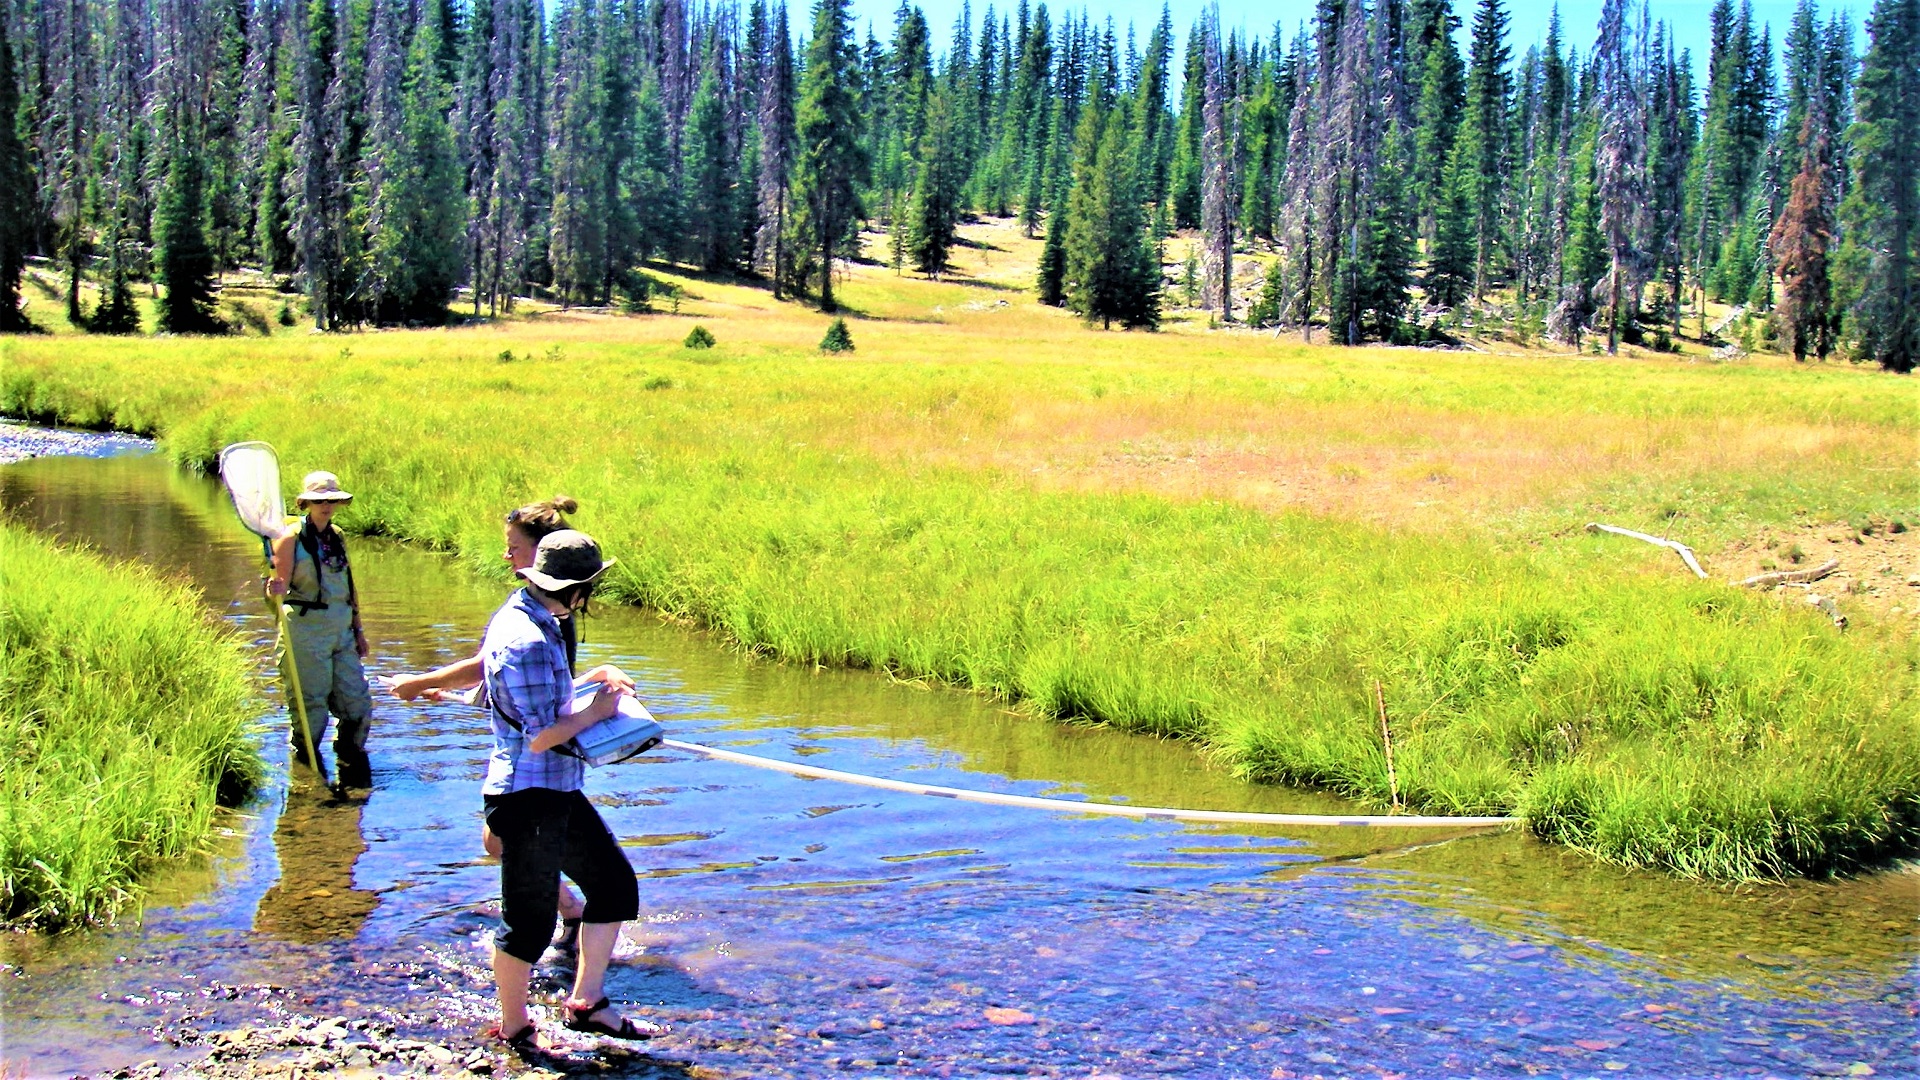
Crews electrofish in streams to understand fish assemblages.
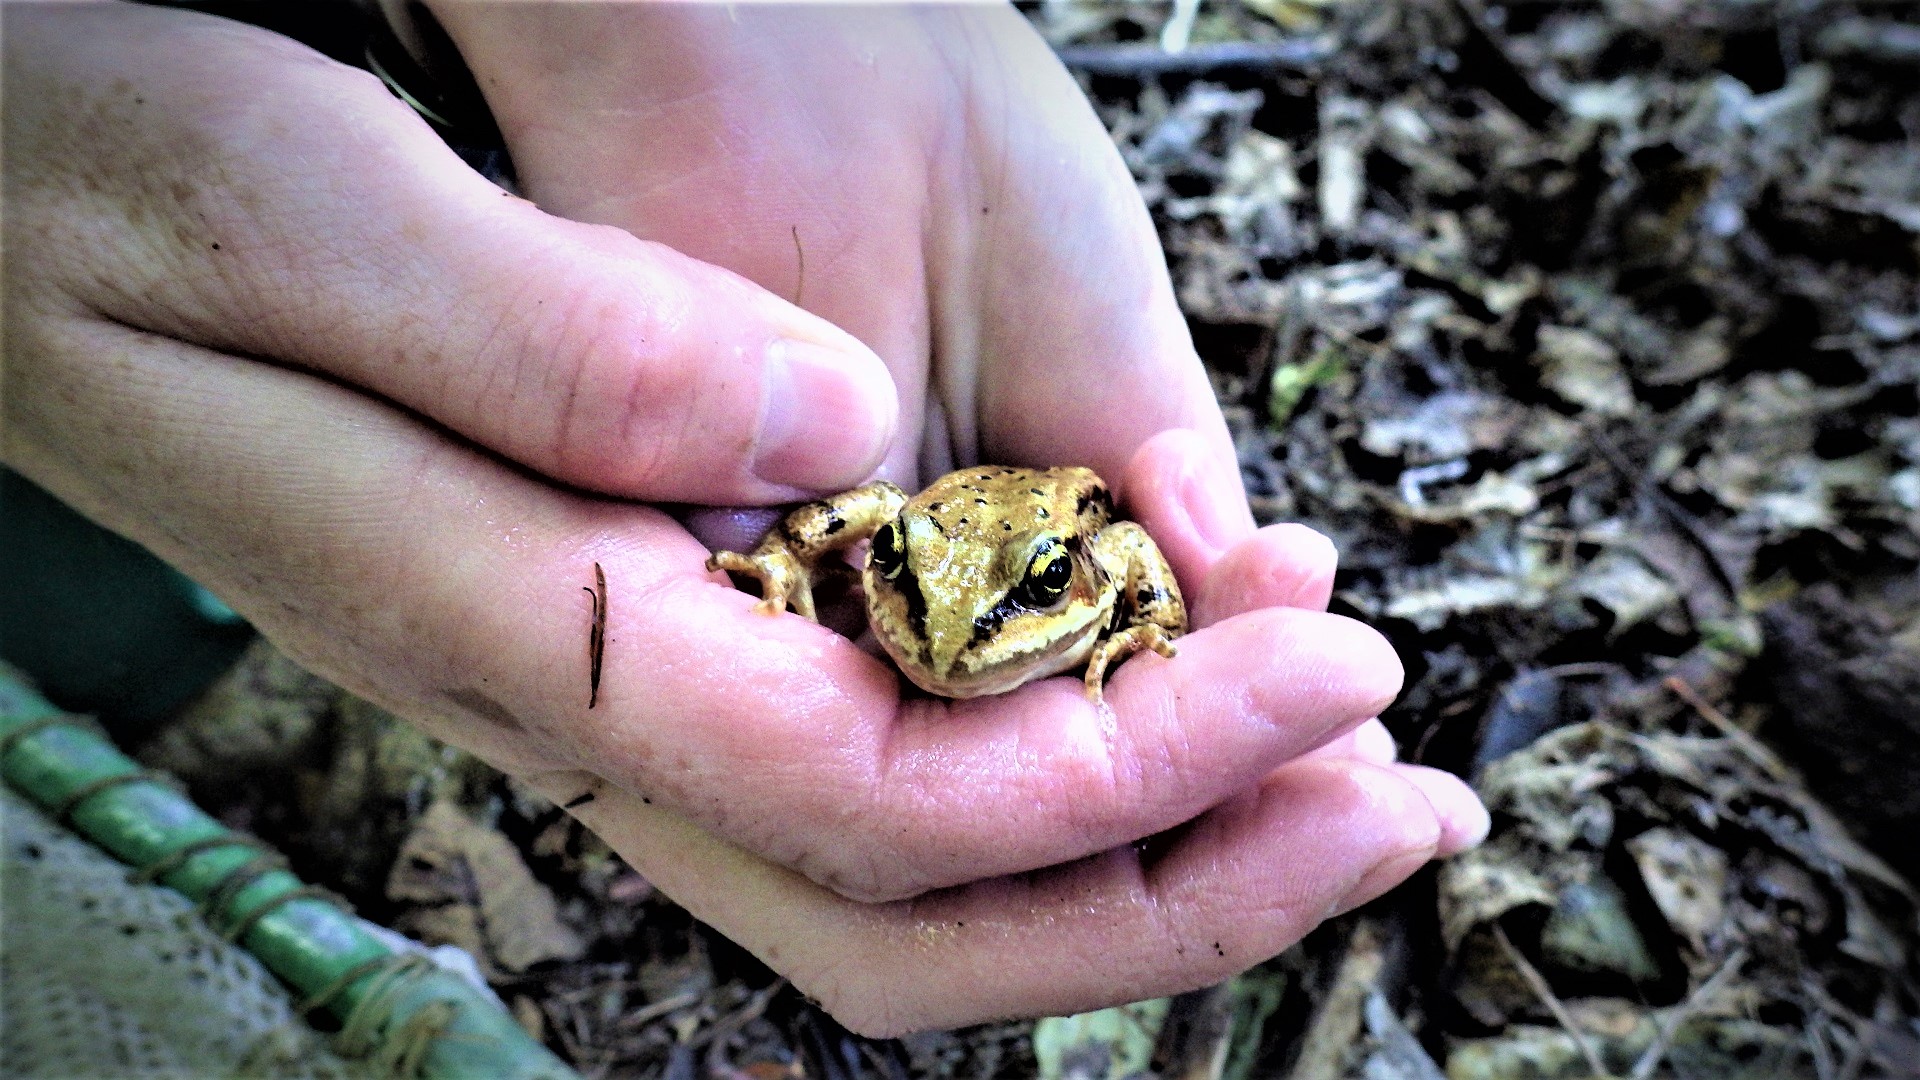
This Cascades frog was found at at Middle Creek.
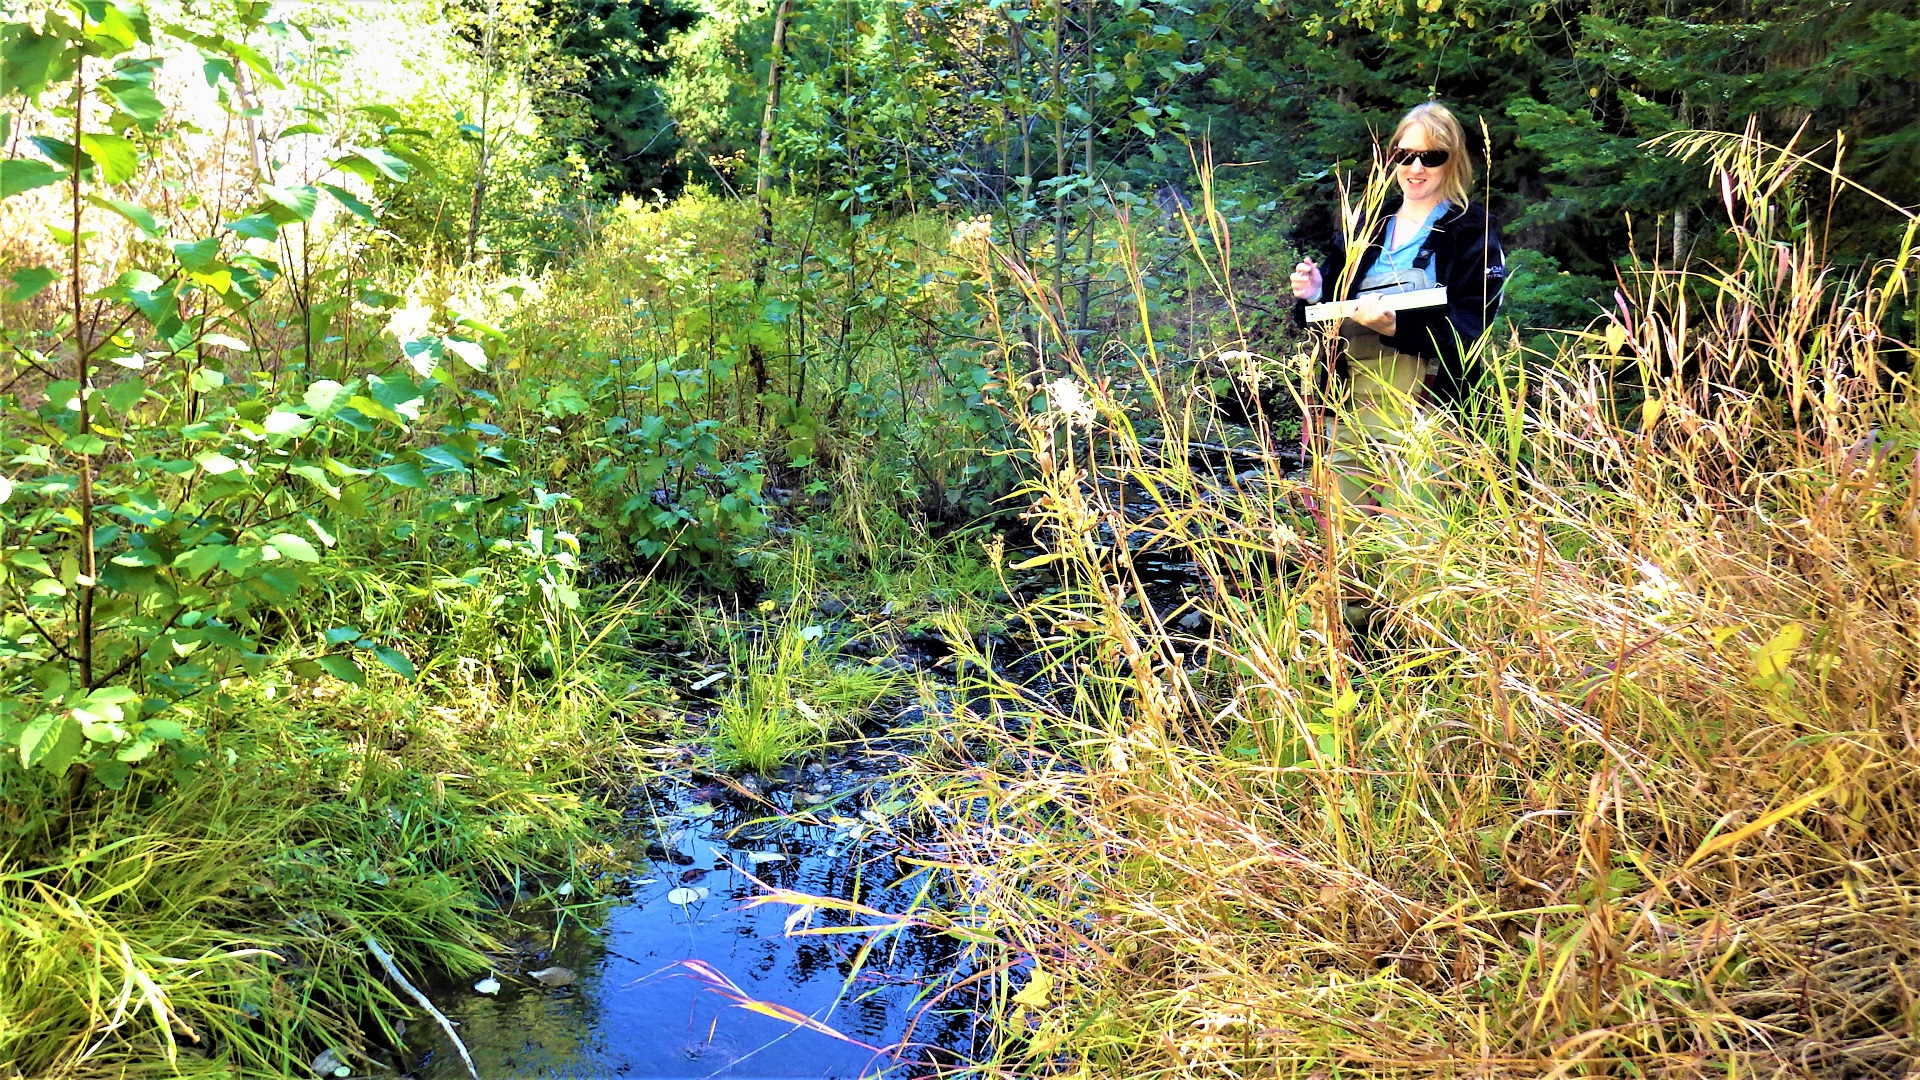
Crewmembers record visual habitat parameters such as fish cover in streams and the percentage of bank covered by vegetation.
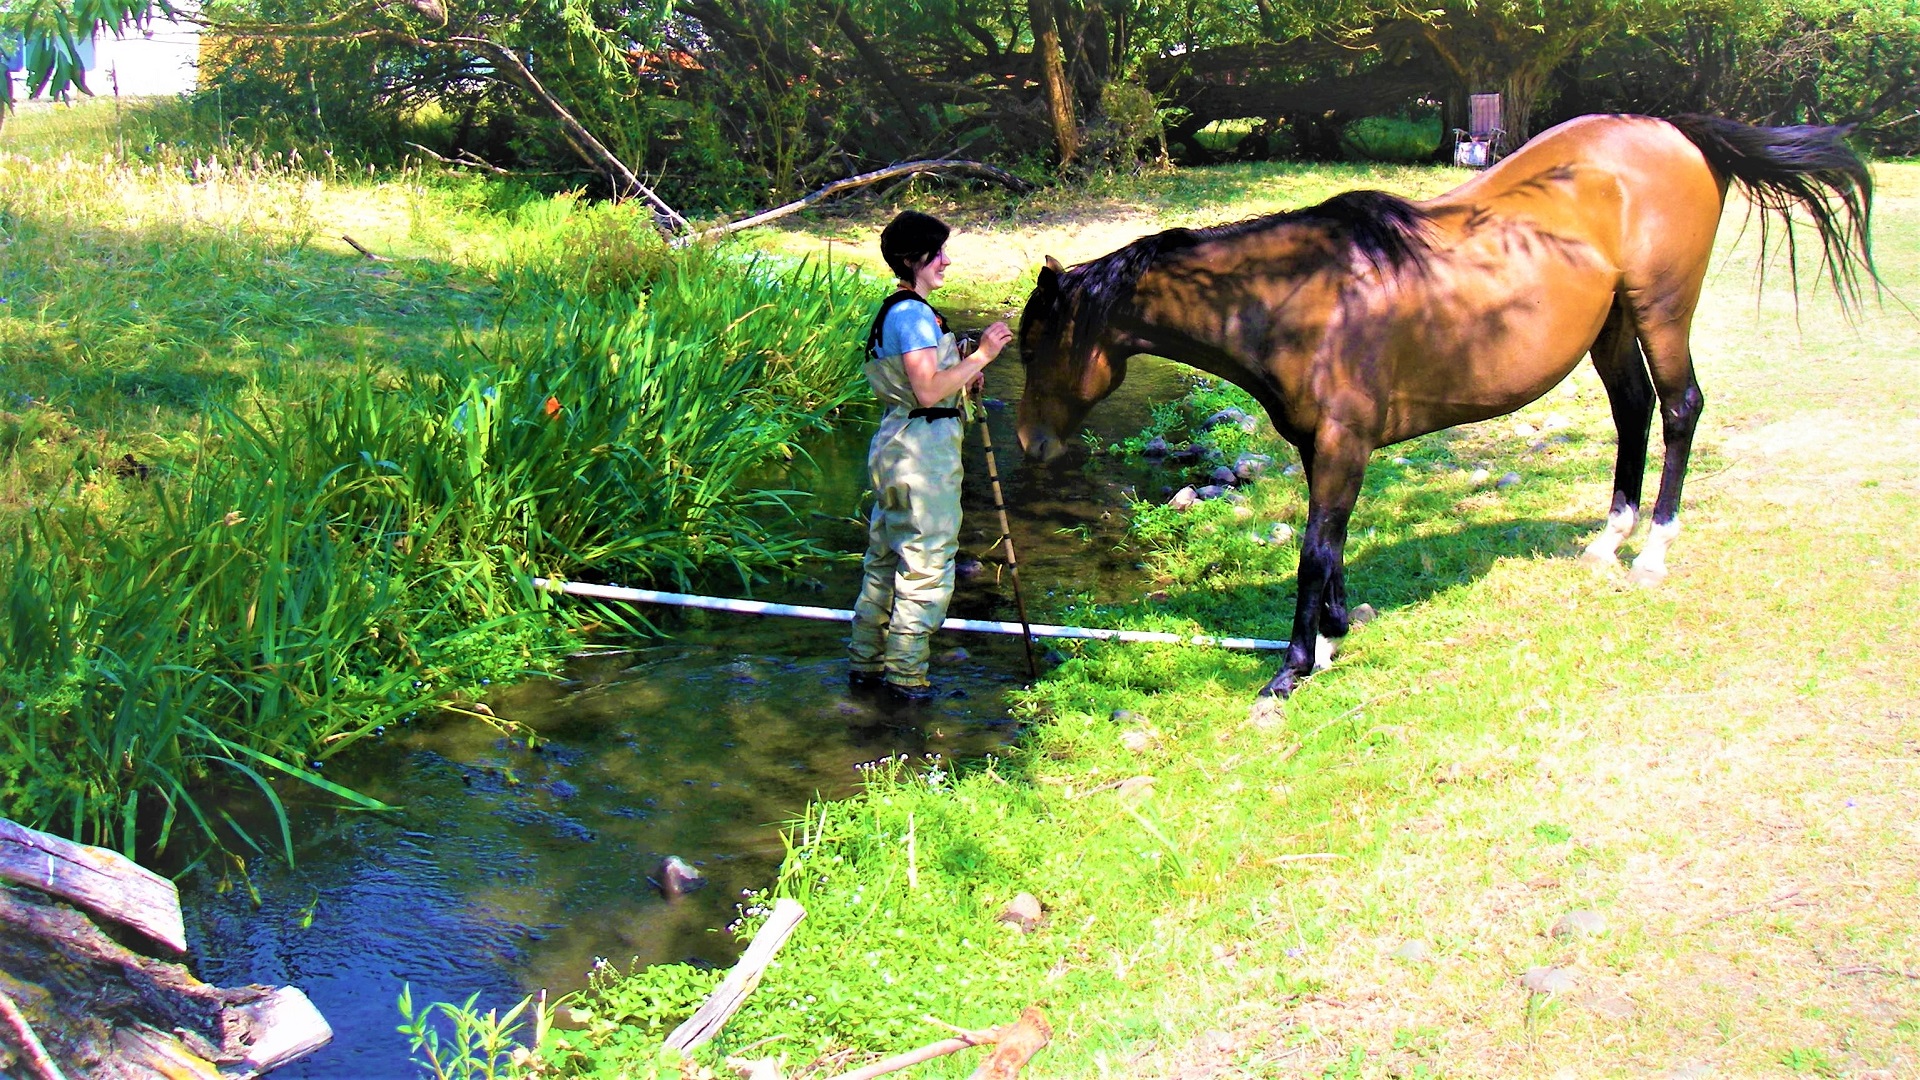
A visitor joins a crew member as they measure the channel width at Mercer Creek.
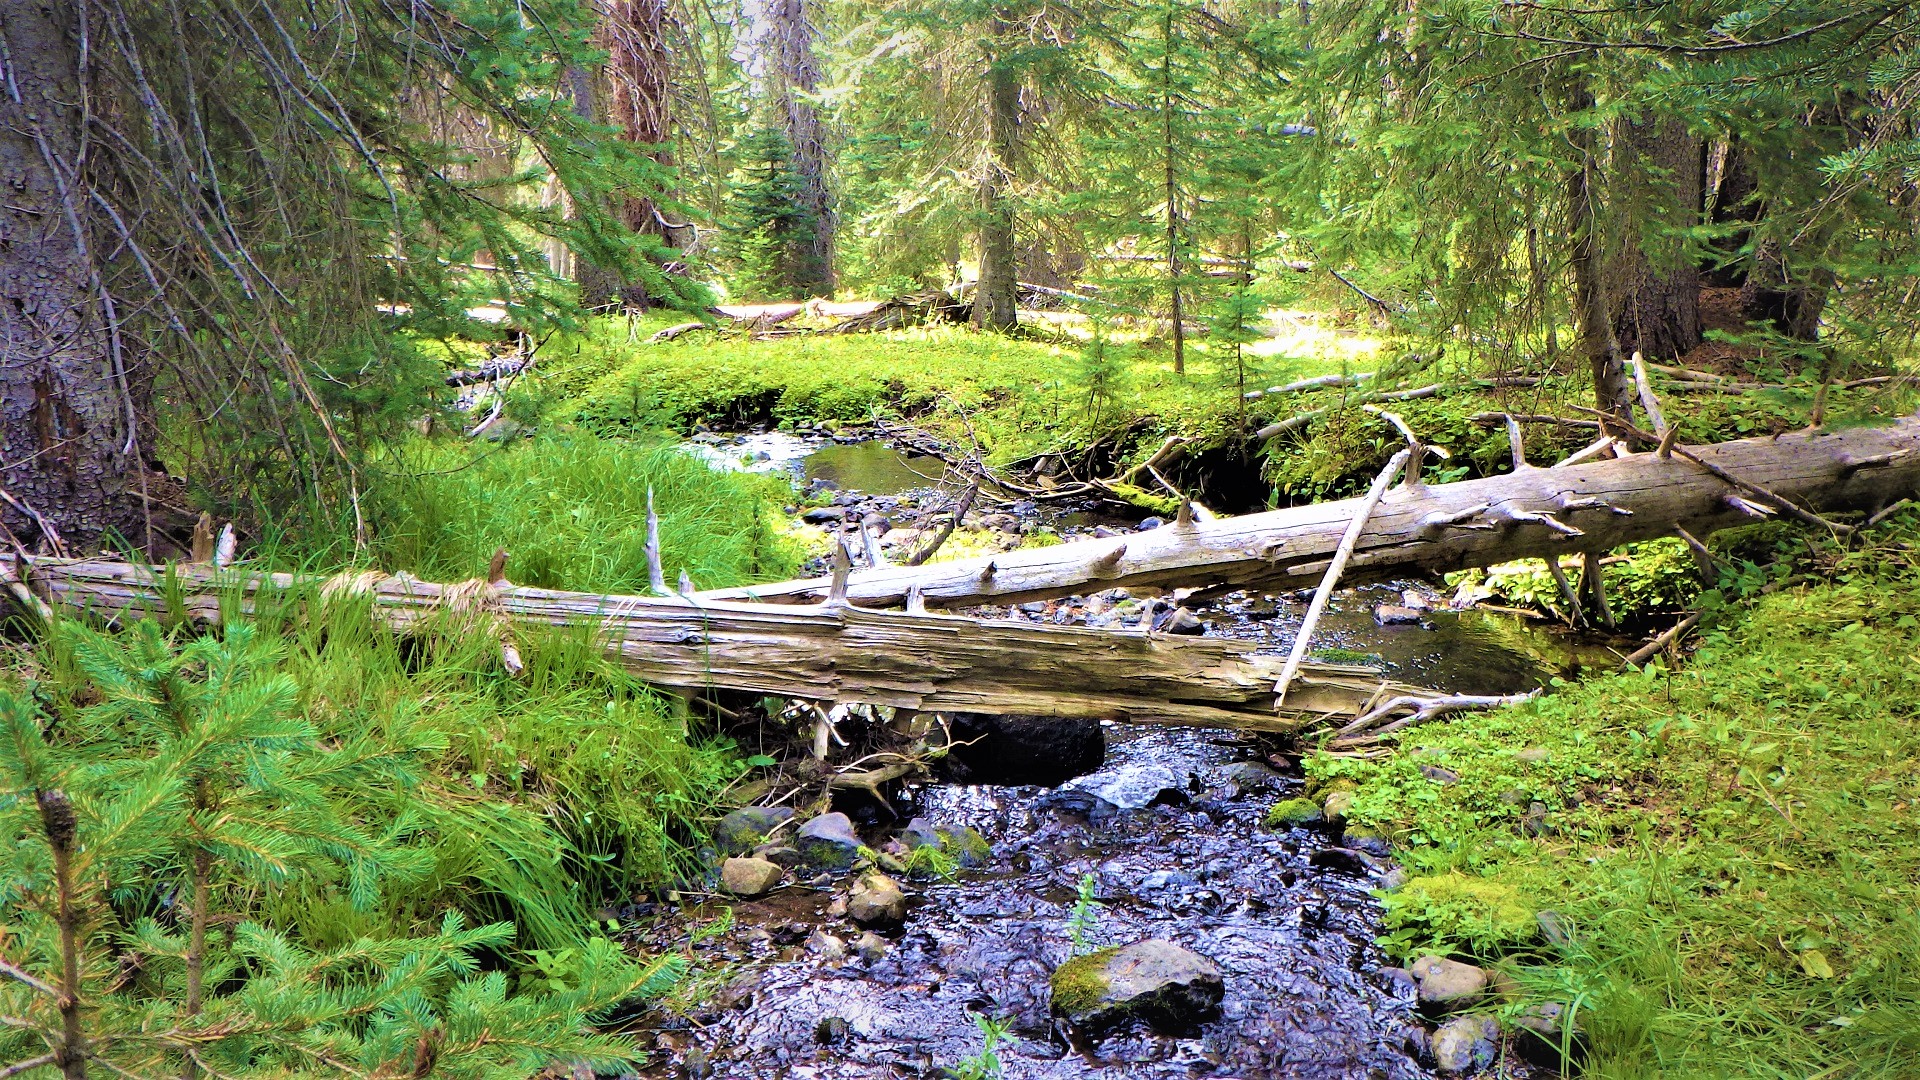
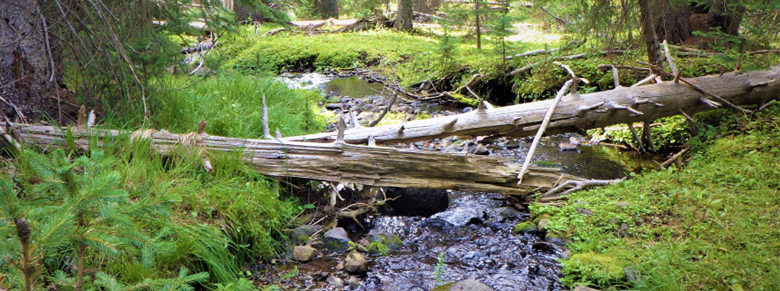
Pieces of large woody debris and overhanging vegetation provide fish cover at Wilson Creek.
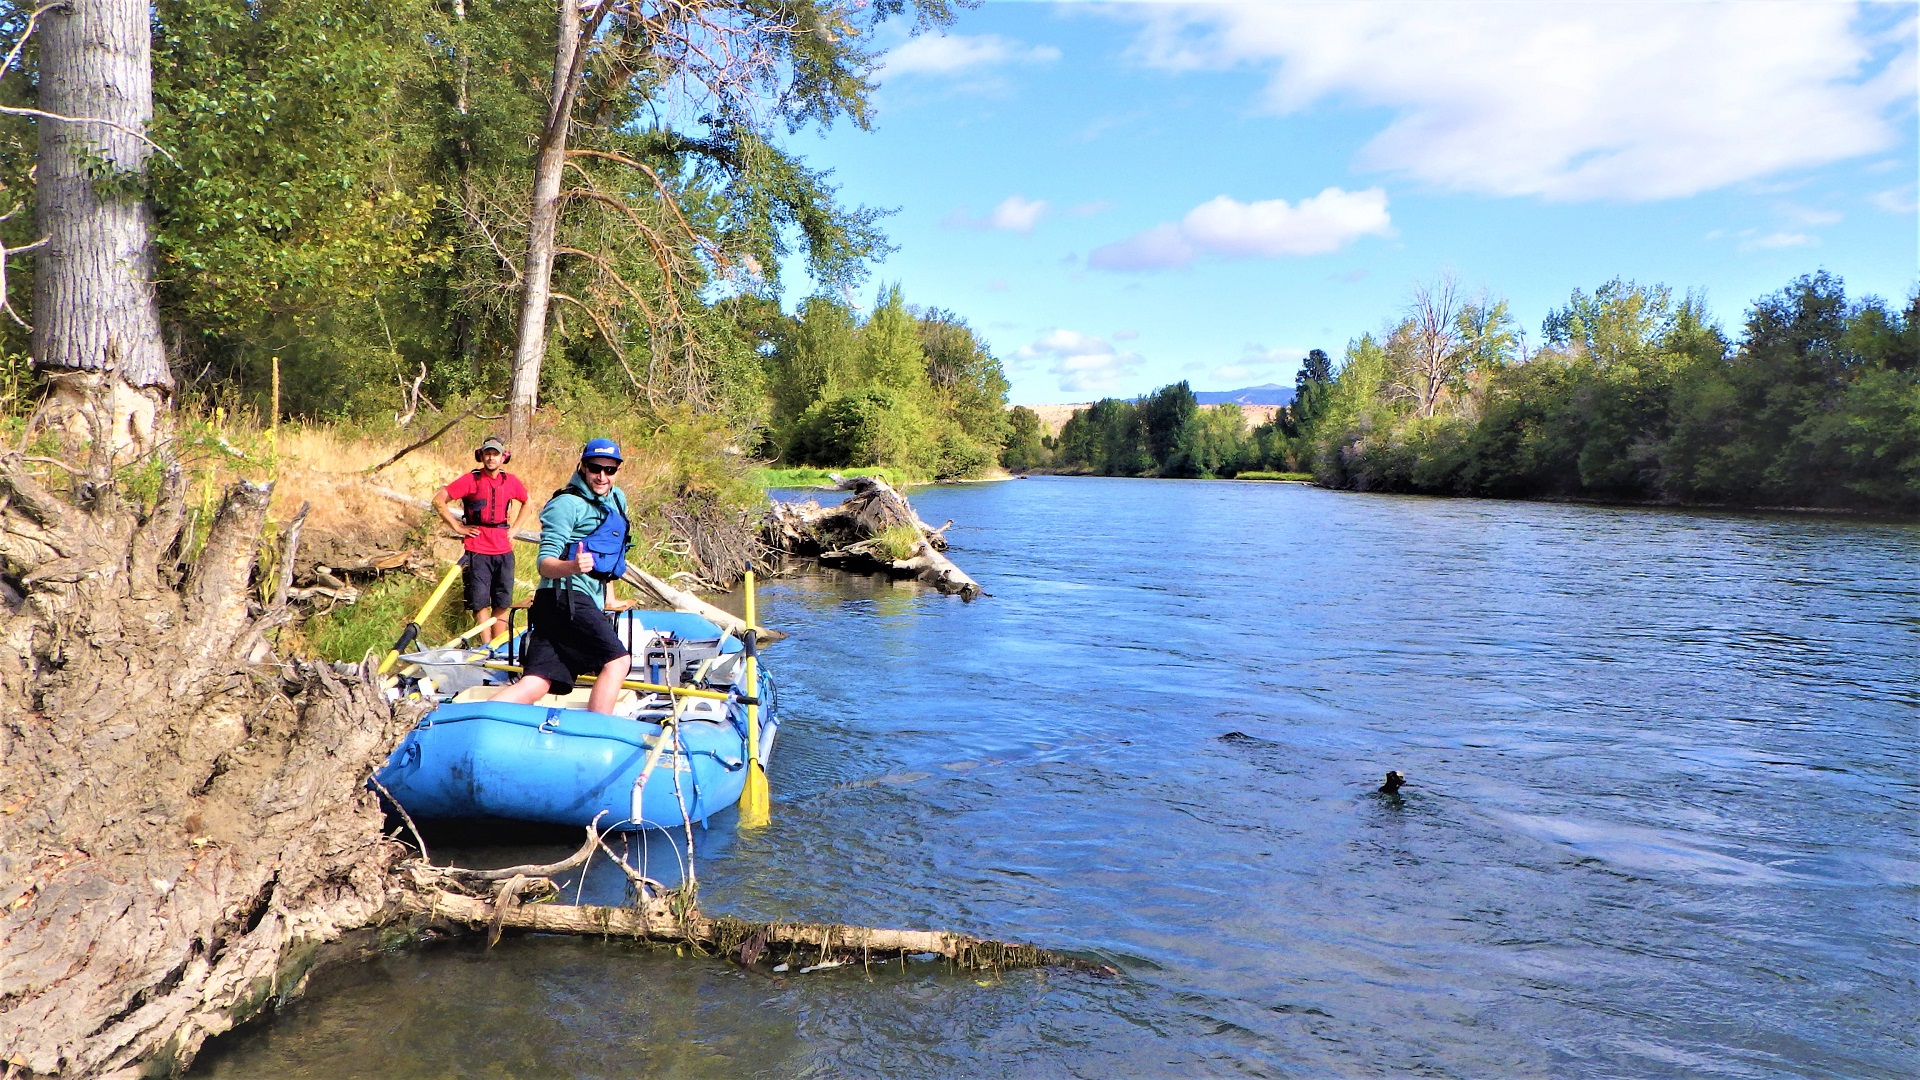
The crew collects data via raft on the Yakima River.
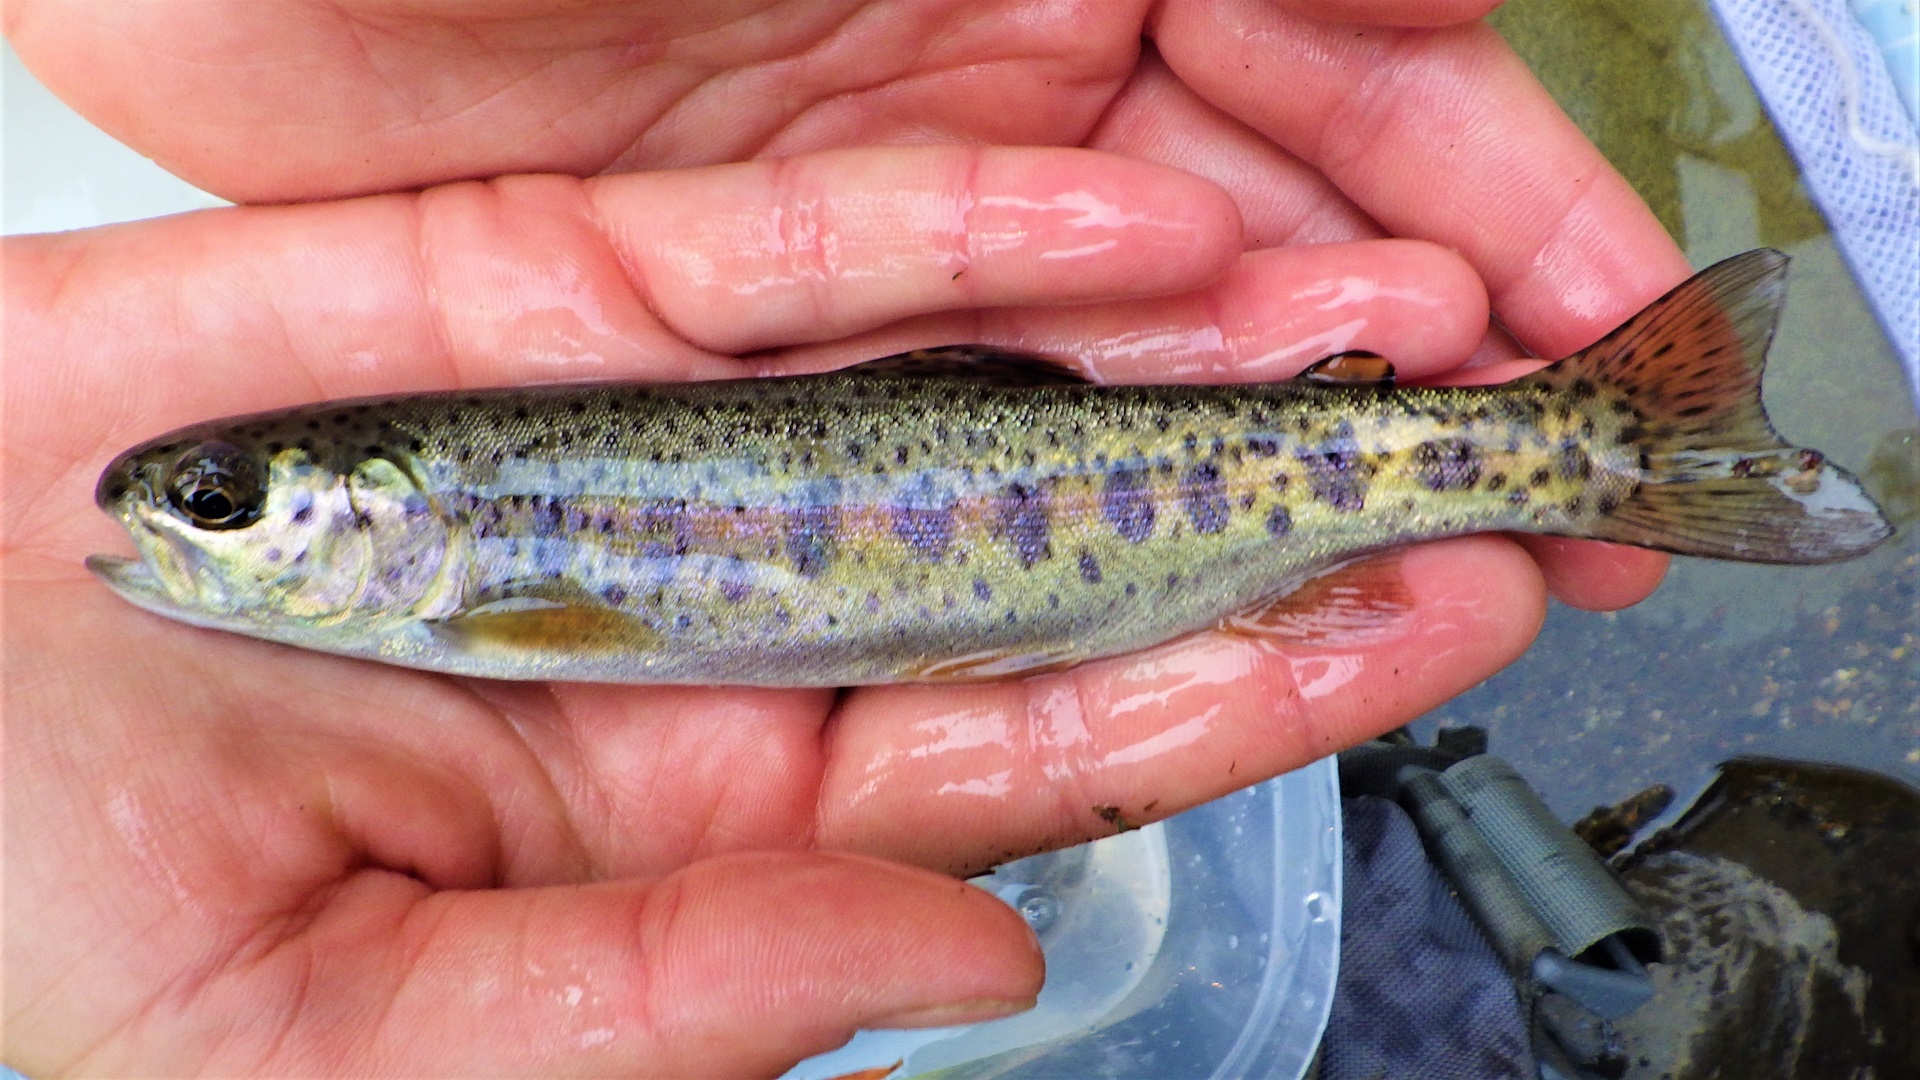
We found this rainbow trout in the Teanaway River.
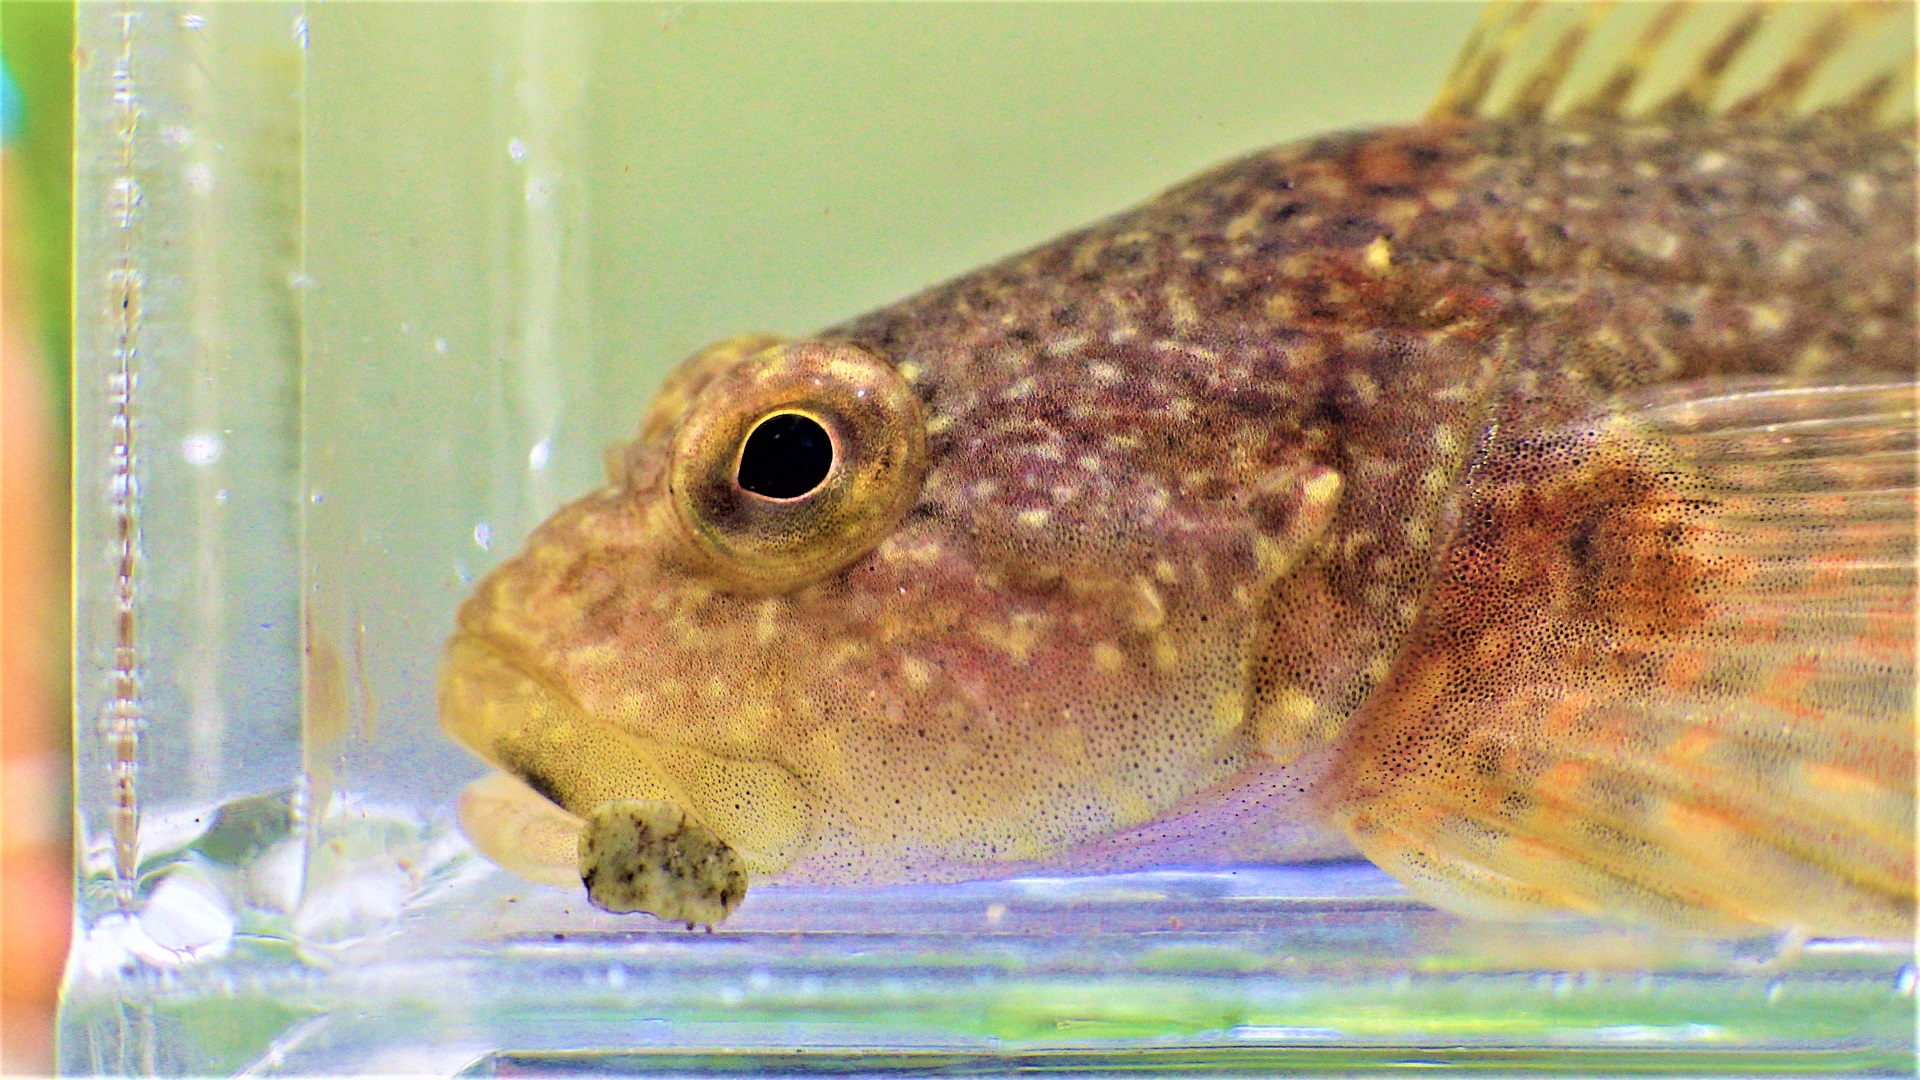
A closeup of this sculpin shows chromatophores, its color-changing cells.
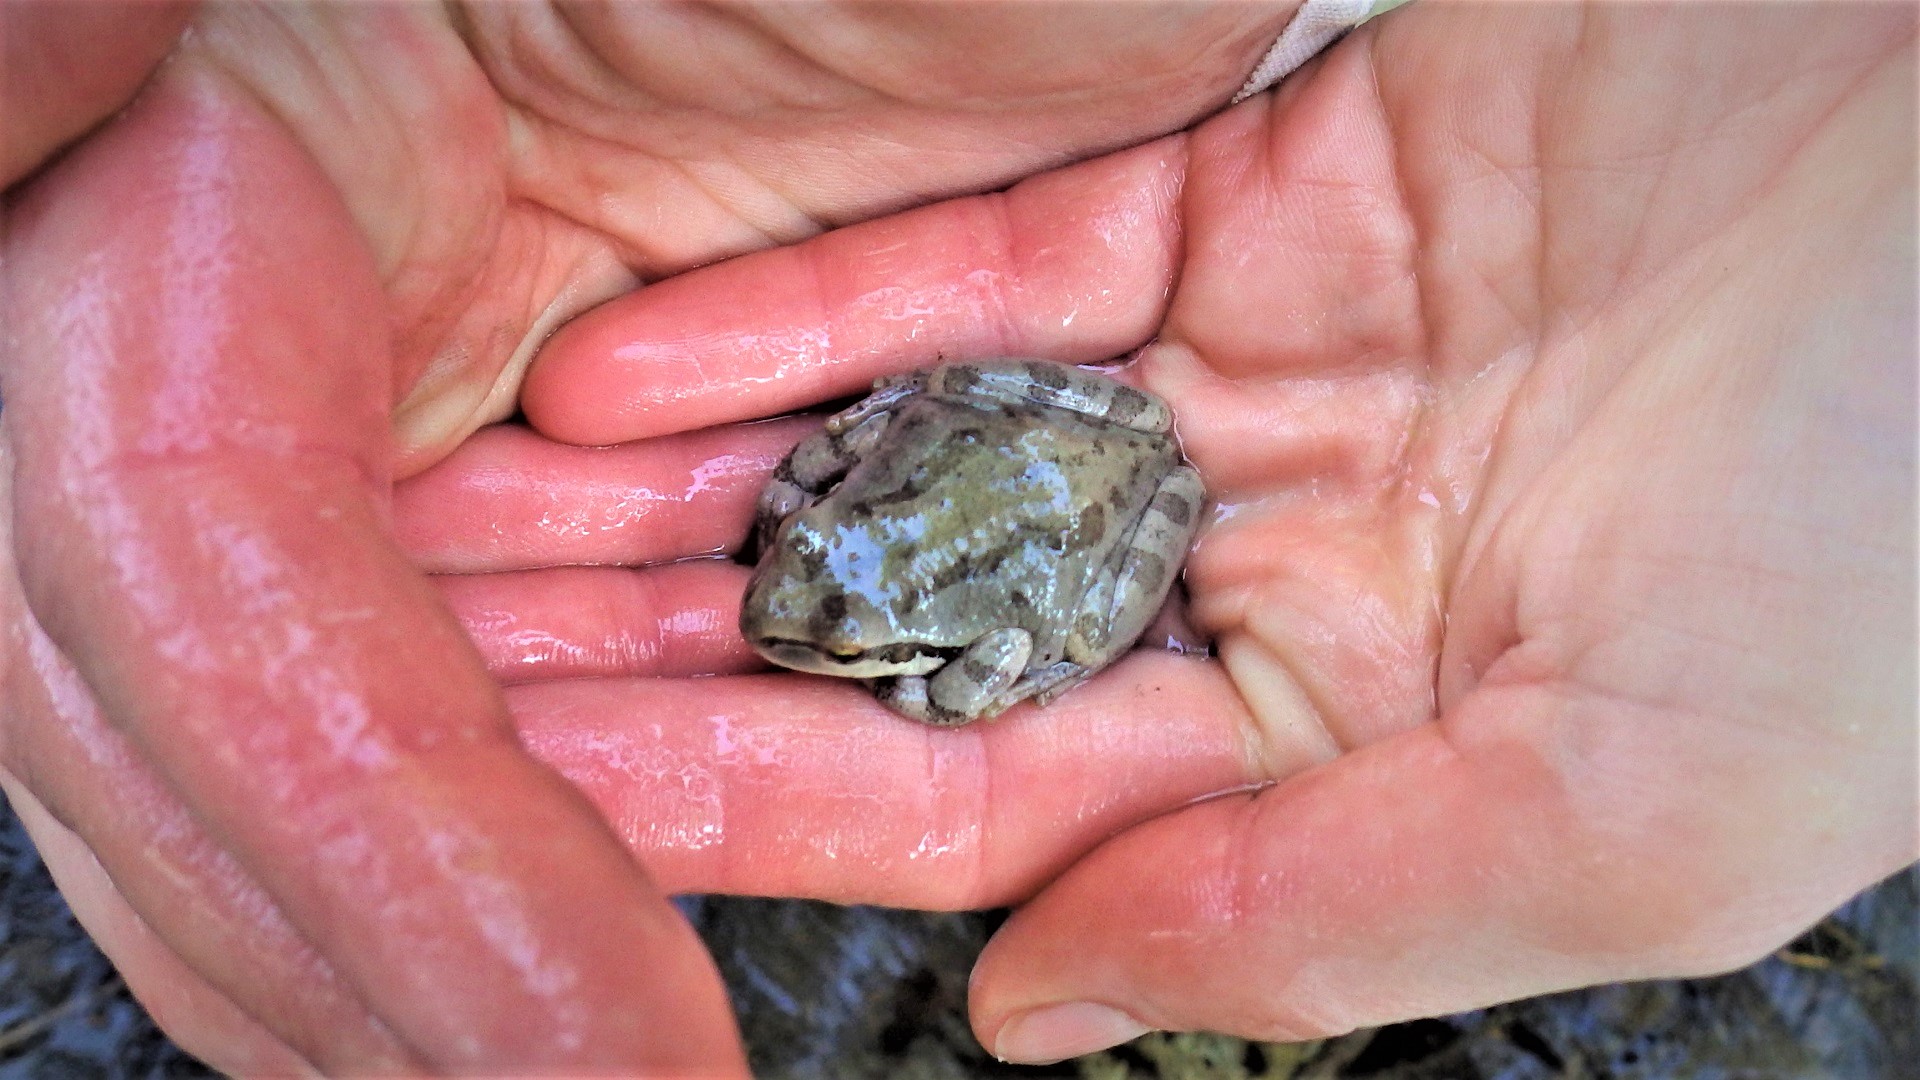
We found this Pacific treefrog at Oak Creek.
Crewmembers measure channel widths at sunny Diamond Fork Creek.
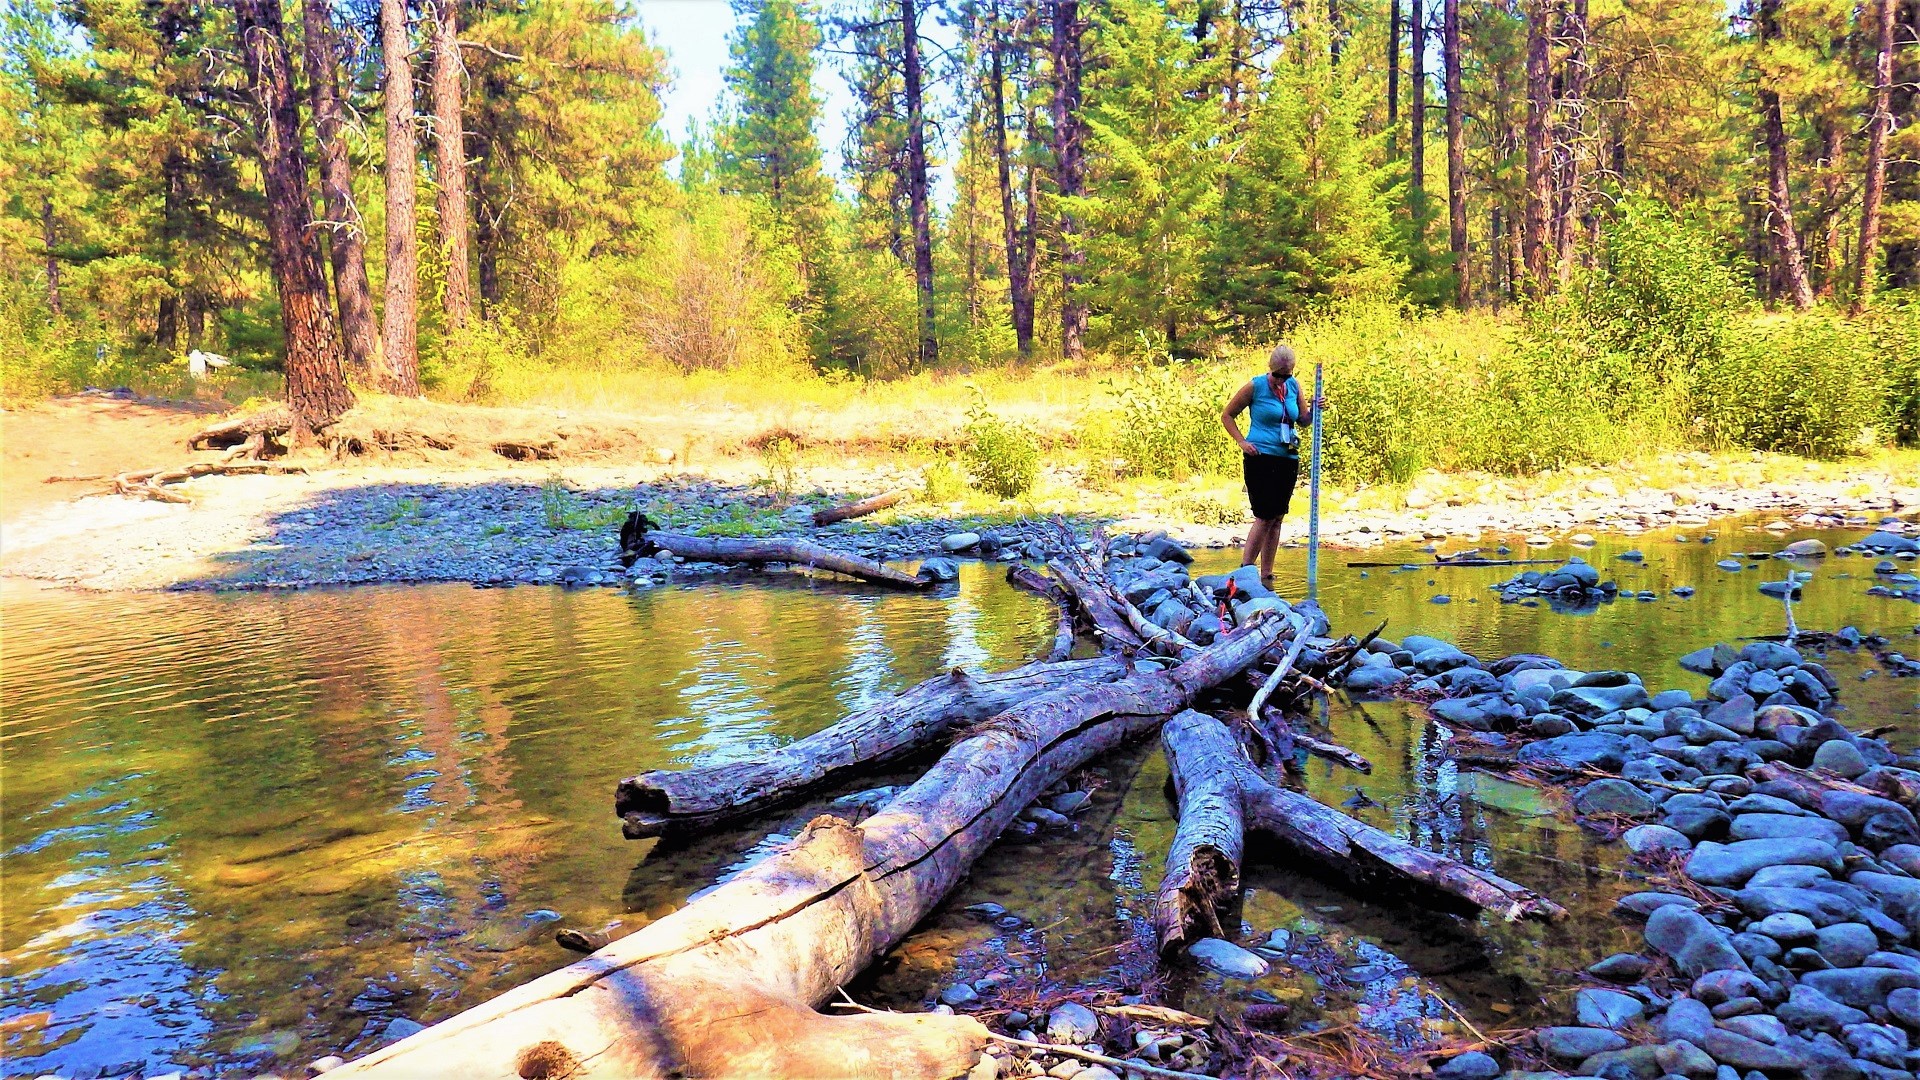
Crewmember takes wetted depths at a human-made log jam on the west fork of the Teanaway River.