

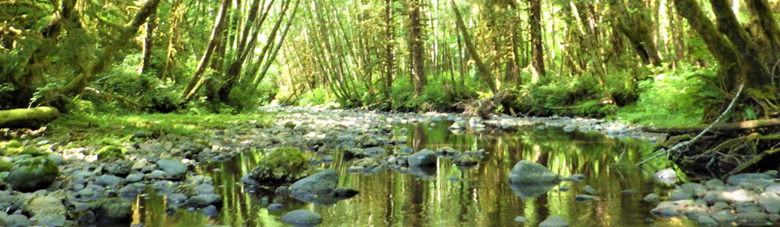
Watershed health — Coastal Region update
We investigated the health of stream habitats in the Coastal Status and Trends Region in 2010, 2014, and 2022. From the first two years of sampling, the region showed moderate biological conditions and high rates of poor bed stability. 2022 data are under review.
Use the map to navigate our reports by Status and Trends Region.
Regional summary
- B-IBI habitat condition scores were consistent in the Coastal Region, with fewer than one third of streams classified as being in poor biological condition.
- The most prevalent stressors for streams in the Coastal Region were poor relative bed stability, low dissolved oxygen, elevated sand/fines, and elevated nitrogen concentrations.
Biological condition
Invertebrate biological condition of streams, as assessed with B-IBI scores, did not change significantly from 2010 to 2014. The proportion of streams classified as good, fair, or poor were not significantly different. In both rounds of sampling, less than one third of streams were in poor biological condition.
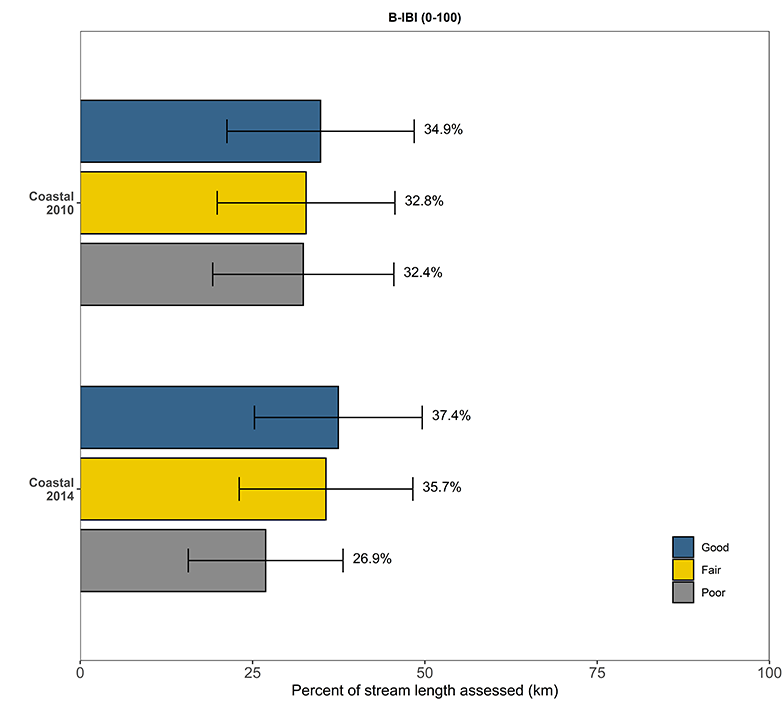
We used B-IBI ratings from 2010 and 2014 to obtain the percentage of stream kilometers in good, fair, and poor conditions for the Coastal Region. Error bars represent 95% confidence intervals.
Significant physical and chemical stressors
In the Coastal Region, the number of stream kilometers assessed as poor for levels of suspended solids and phosphorus increased between 2010 and 2014. Some of the common physiochemical stressors in this region were those associated with the stream substrate, specifically bed stability, sand/fines, and embeddedness. Poor dissolved oxygen and high nitrogen were also prevalent in this region.
To interact with this graph to learn more about these stressors, hold your mouse over each bar.
This interactive graph shows the percentage of stream kilometers assessed with poor physiochemical conditions in the Coastal Region for 2010 and 2014. The x-axis represents the percentage of river extent in poor condition. Error bars show 95% confidence intervals.
Flip through our field photos!
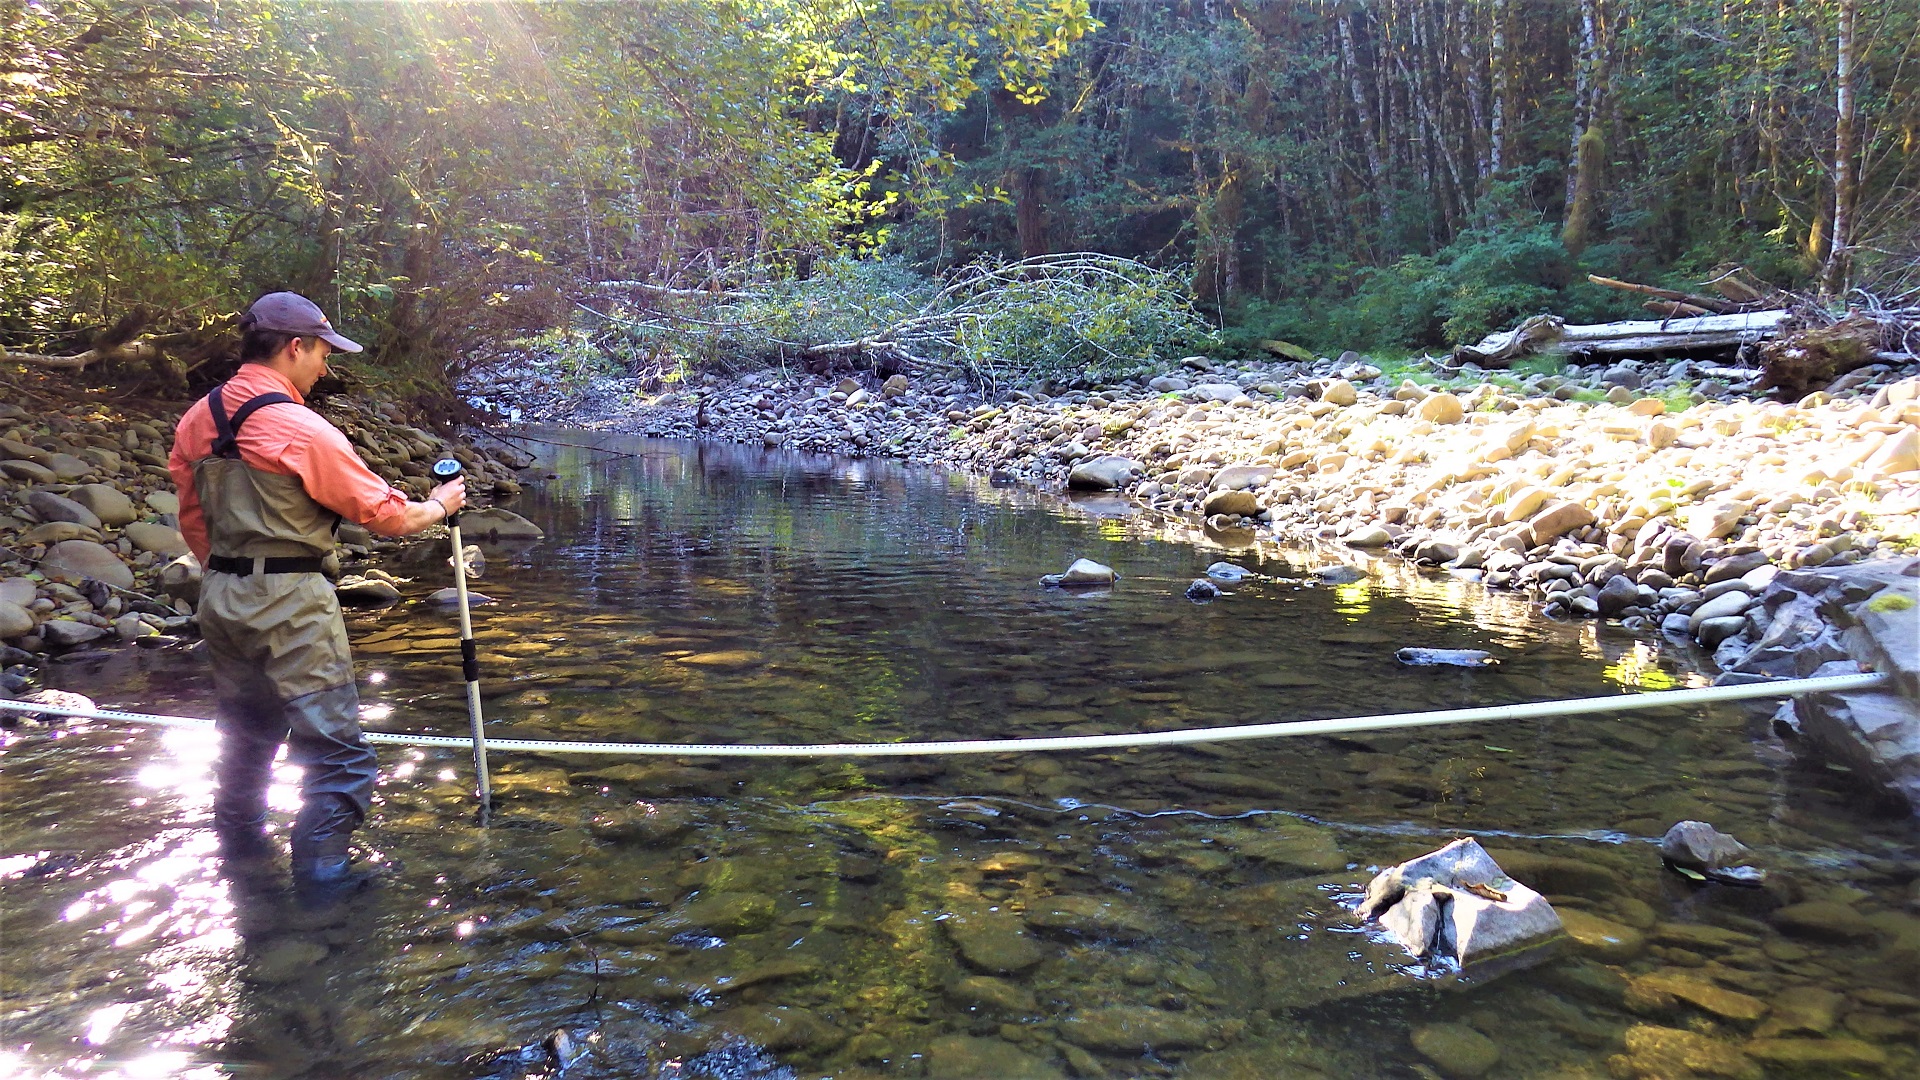
A crewmember measures the rate of flow at Stequaleho Creek.
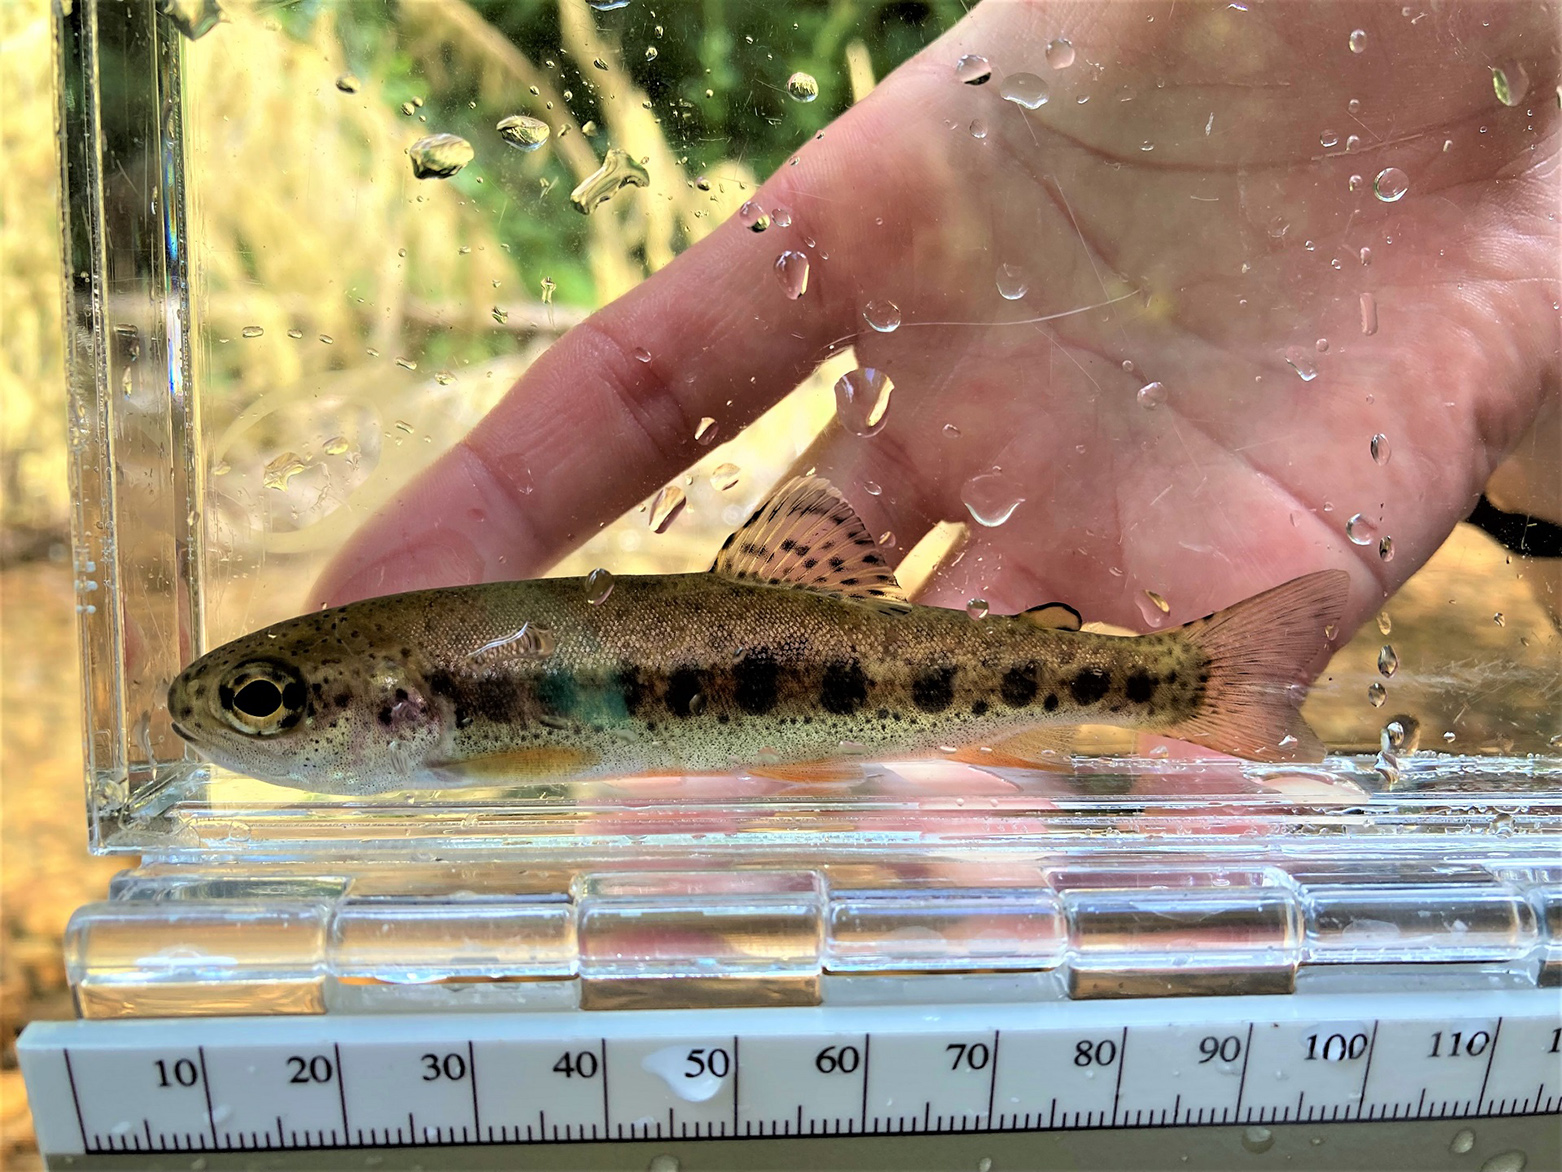
A juvenile rainbow trout is measured and recorded.
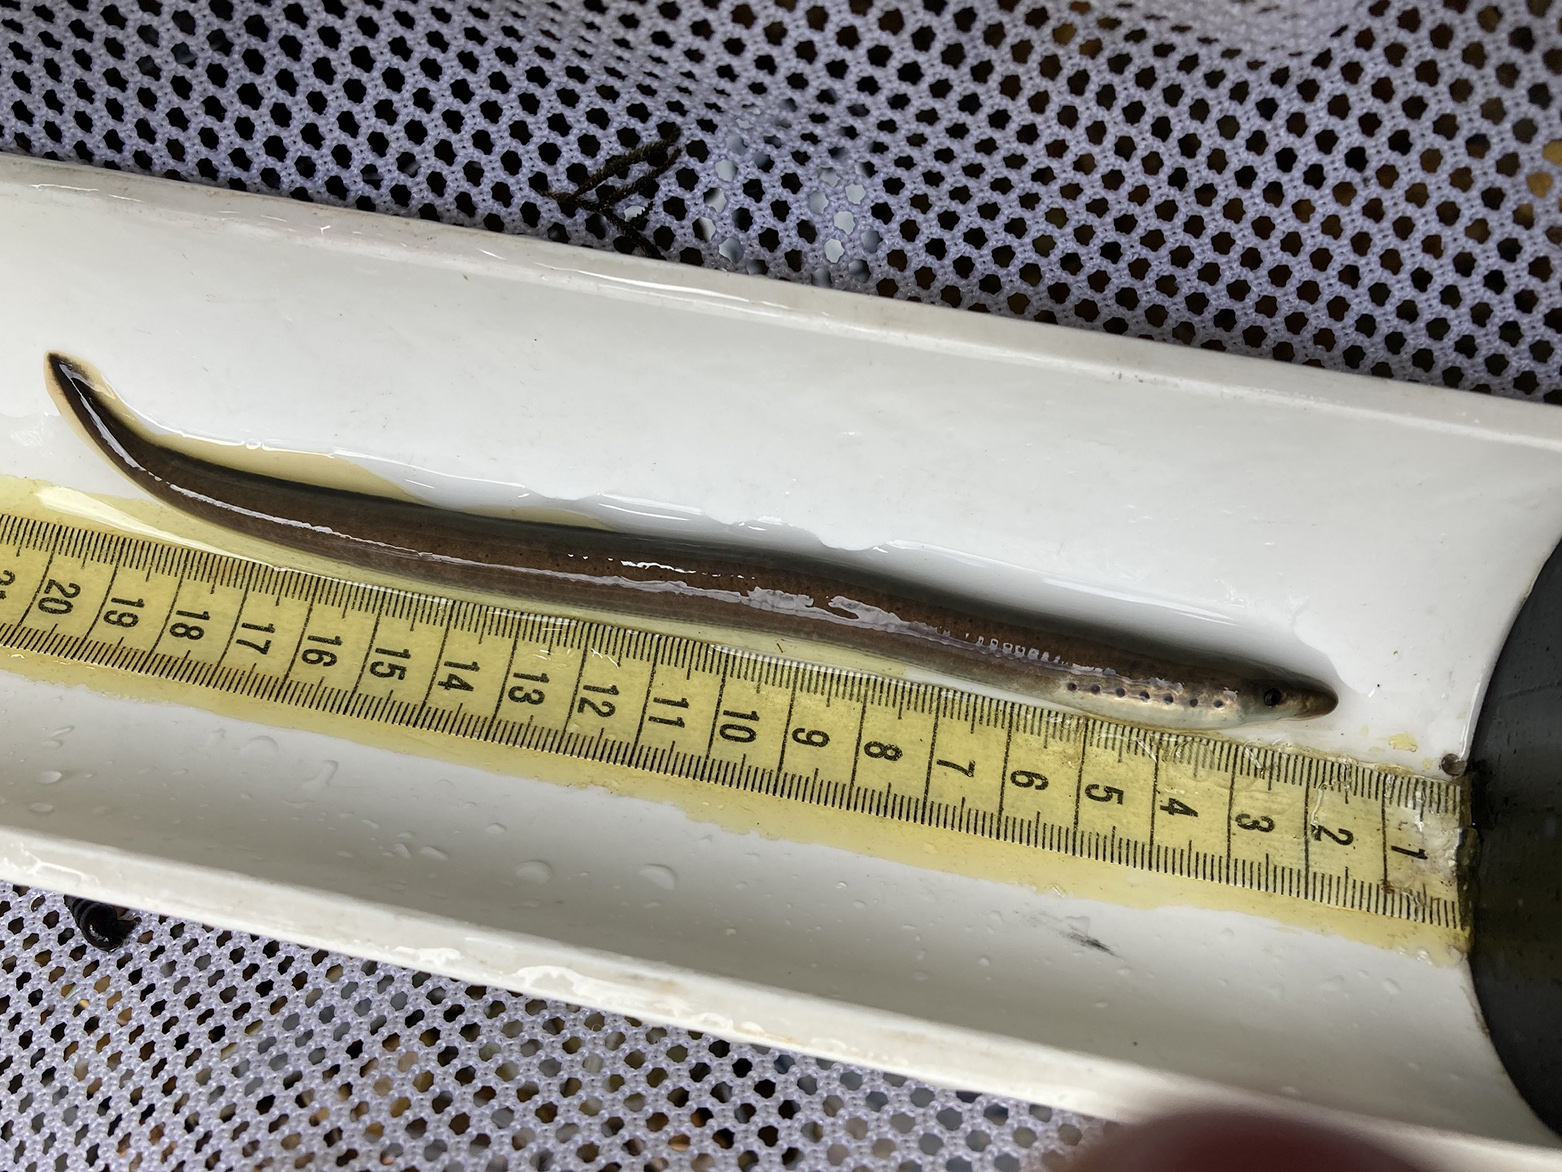
We measure the length of a juvenile lamprey from Ellsworth Creek.
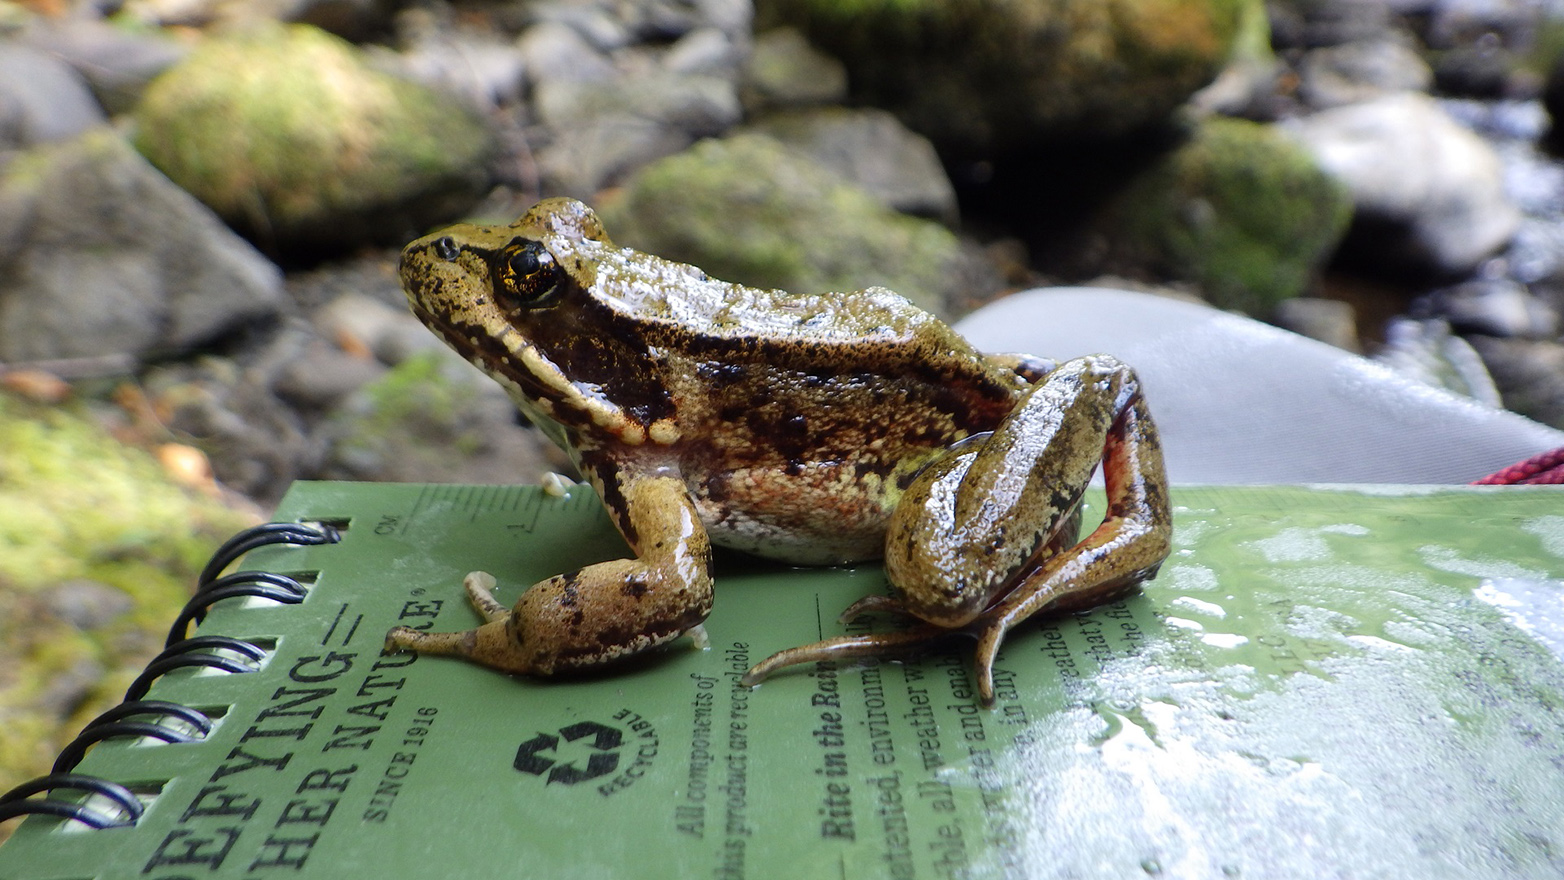
A northern red-legged frog from Christmas Creek poses for the camera.
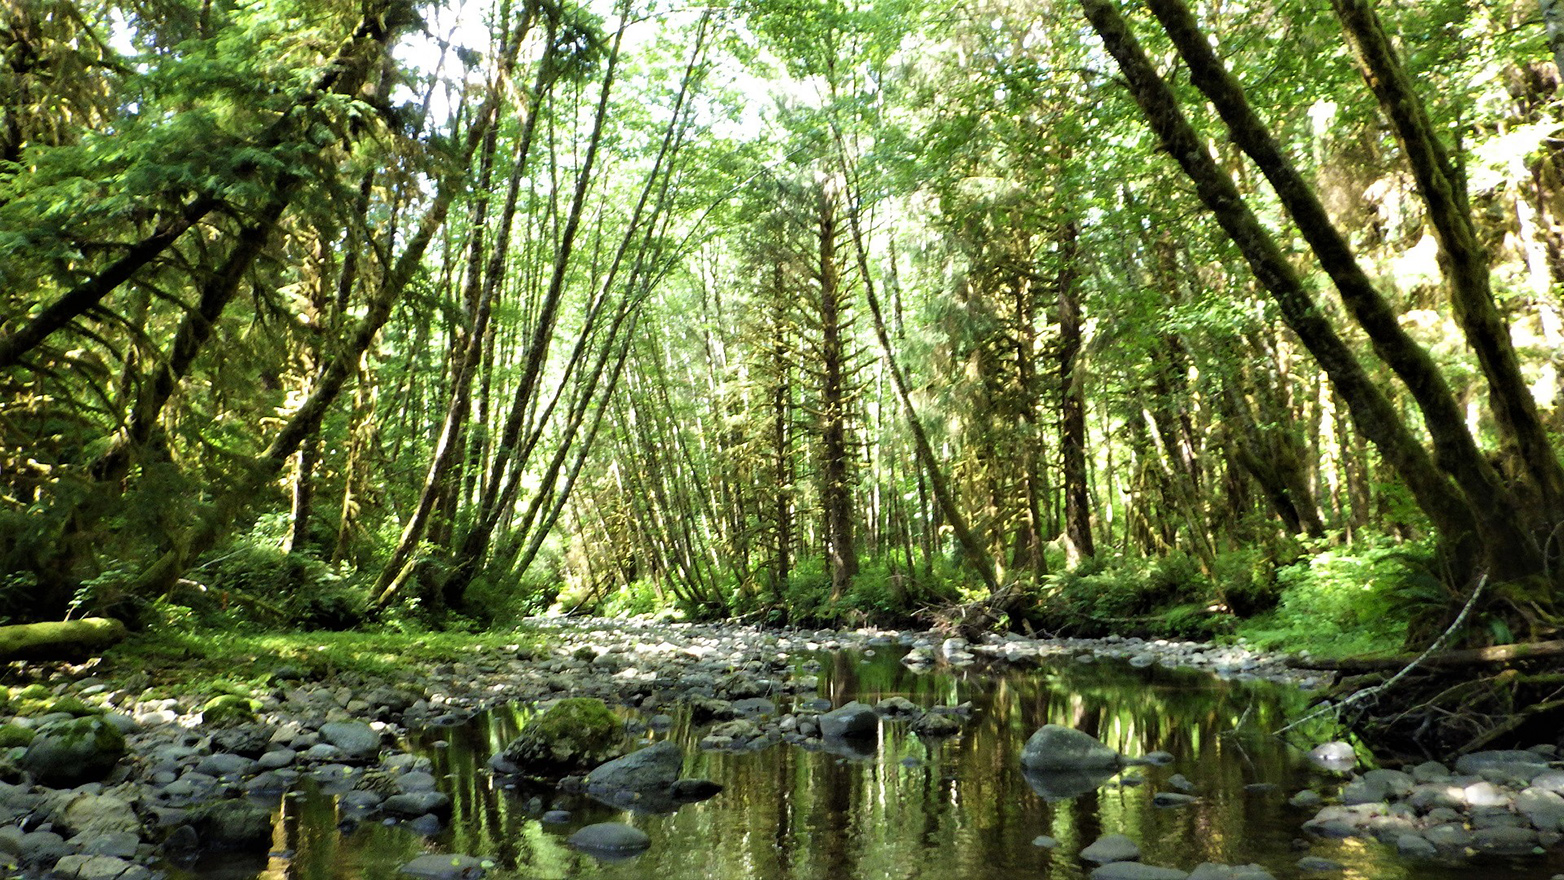
Christmas Creek has dense canopy cover from deciduous and coniferous trees.
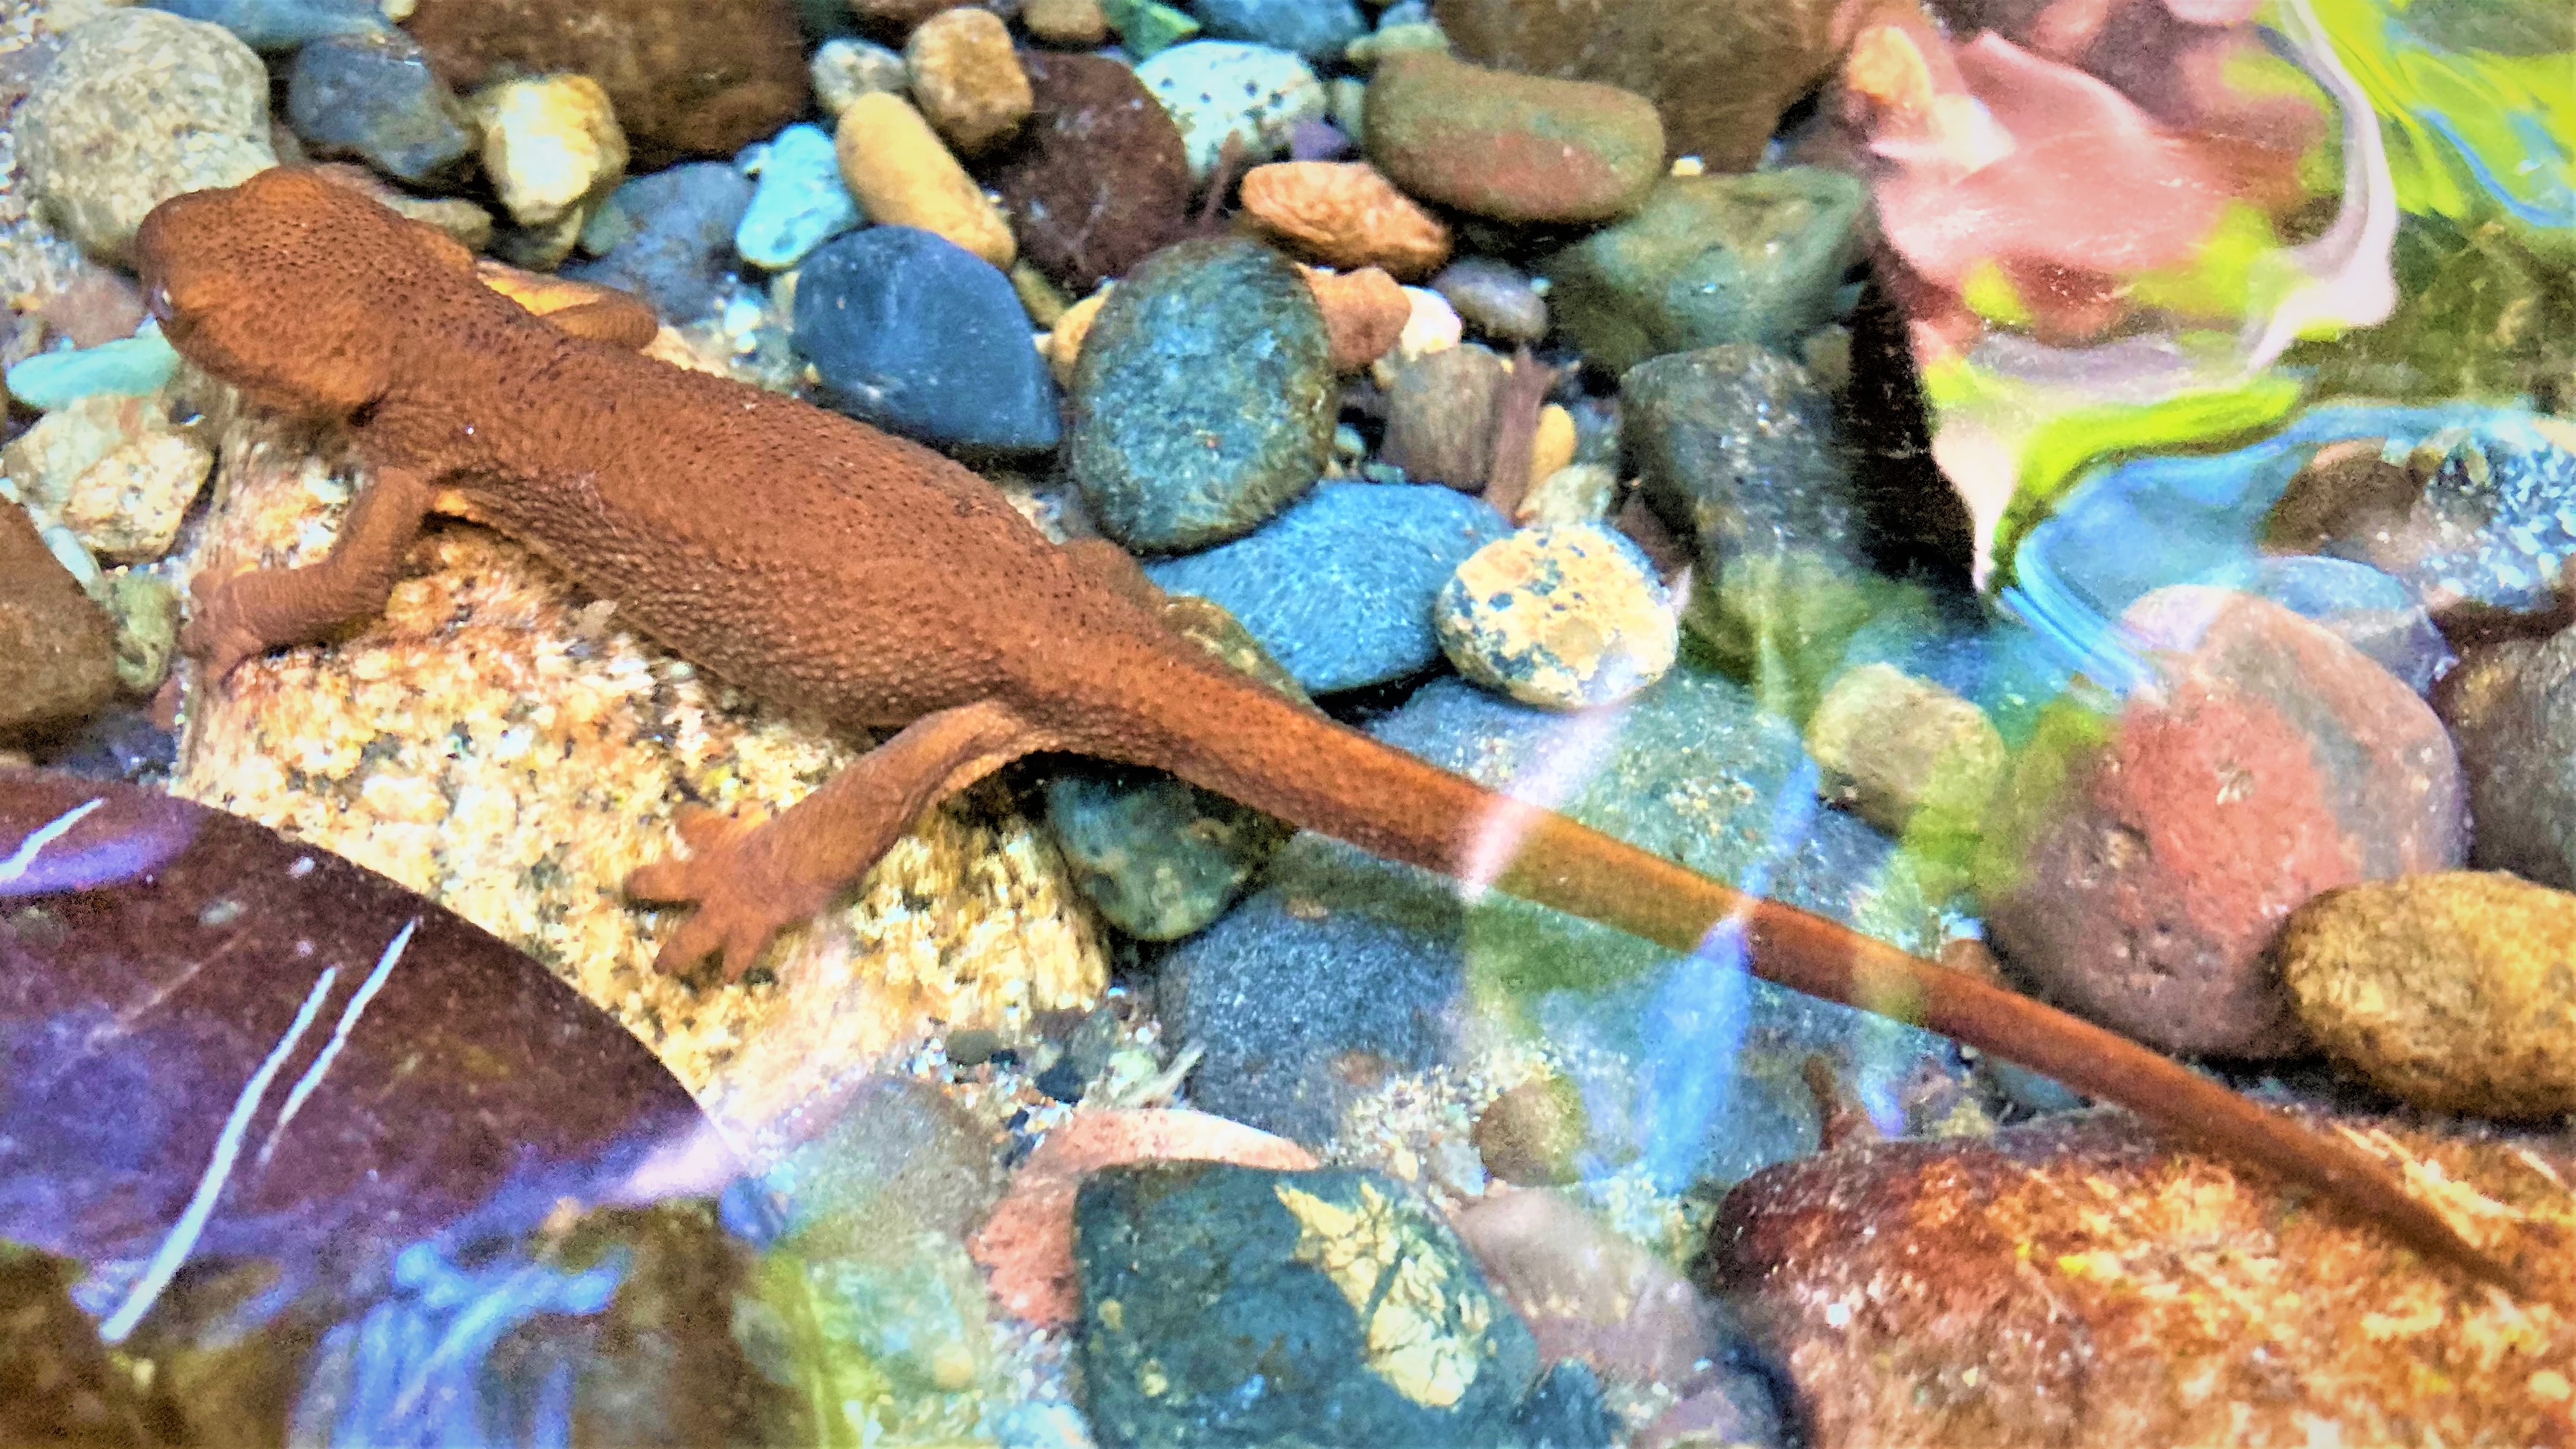
A rough-skinned newt camouflages in a stream in the Coastal Region.